Get to Know the Business

If you haven’t read Part 1 of this 6 part series, it shows us what narrative based investing is, and how to find our own circle of competence !
Also, if you’re keen, you can check out the SWS Investment checklist , it’s what this series is built around and it’ll help you make informed investing decisions.
Now, let’s dive into how to get to know the business!
Many investors forget that stock ownership is business ownership .
The stock represents a business, and that business sells products or services. It spends money to operate, innovate and ultimately grow its business. It operates within an industry where it’s competing with others who are trying to do the exact same.
Yet so many “investors” (who we’ll call “speculators”) ignore these important aspects and make their buy/sell decisions based purely on either emotional swings or unfounded guesses.
But we don’t want to be speculators. We want to be investors.
So here are the two main reasons we need to know how the underlying business works:
If we understand how the business makes and spends money, who its competitors are, what makes it different from them, what the industry’s future prospects are like, what risks it faces, etc., then not only are we well informed on the business we’re potentially buying, we are putting ourselves in a much better position to making informed estimates of the future.
Now that we’re clear about WHY we need to do this, let’s look at HOW we can do it. We have a few options, the first being simpler, and the second being more in-depth. Both will get you up to speed.
One of the easiest spots to get started is the Simply Wall St company report. All you have to do is click “ About the company ” at the top of the report and read the expanded text (below) to get up to speed on how the business operates.
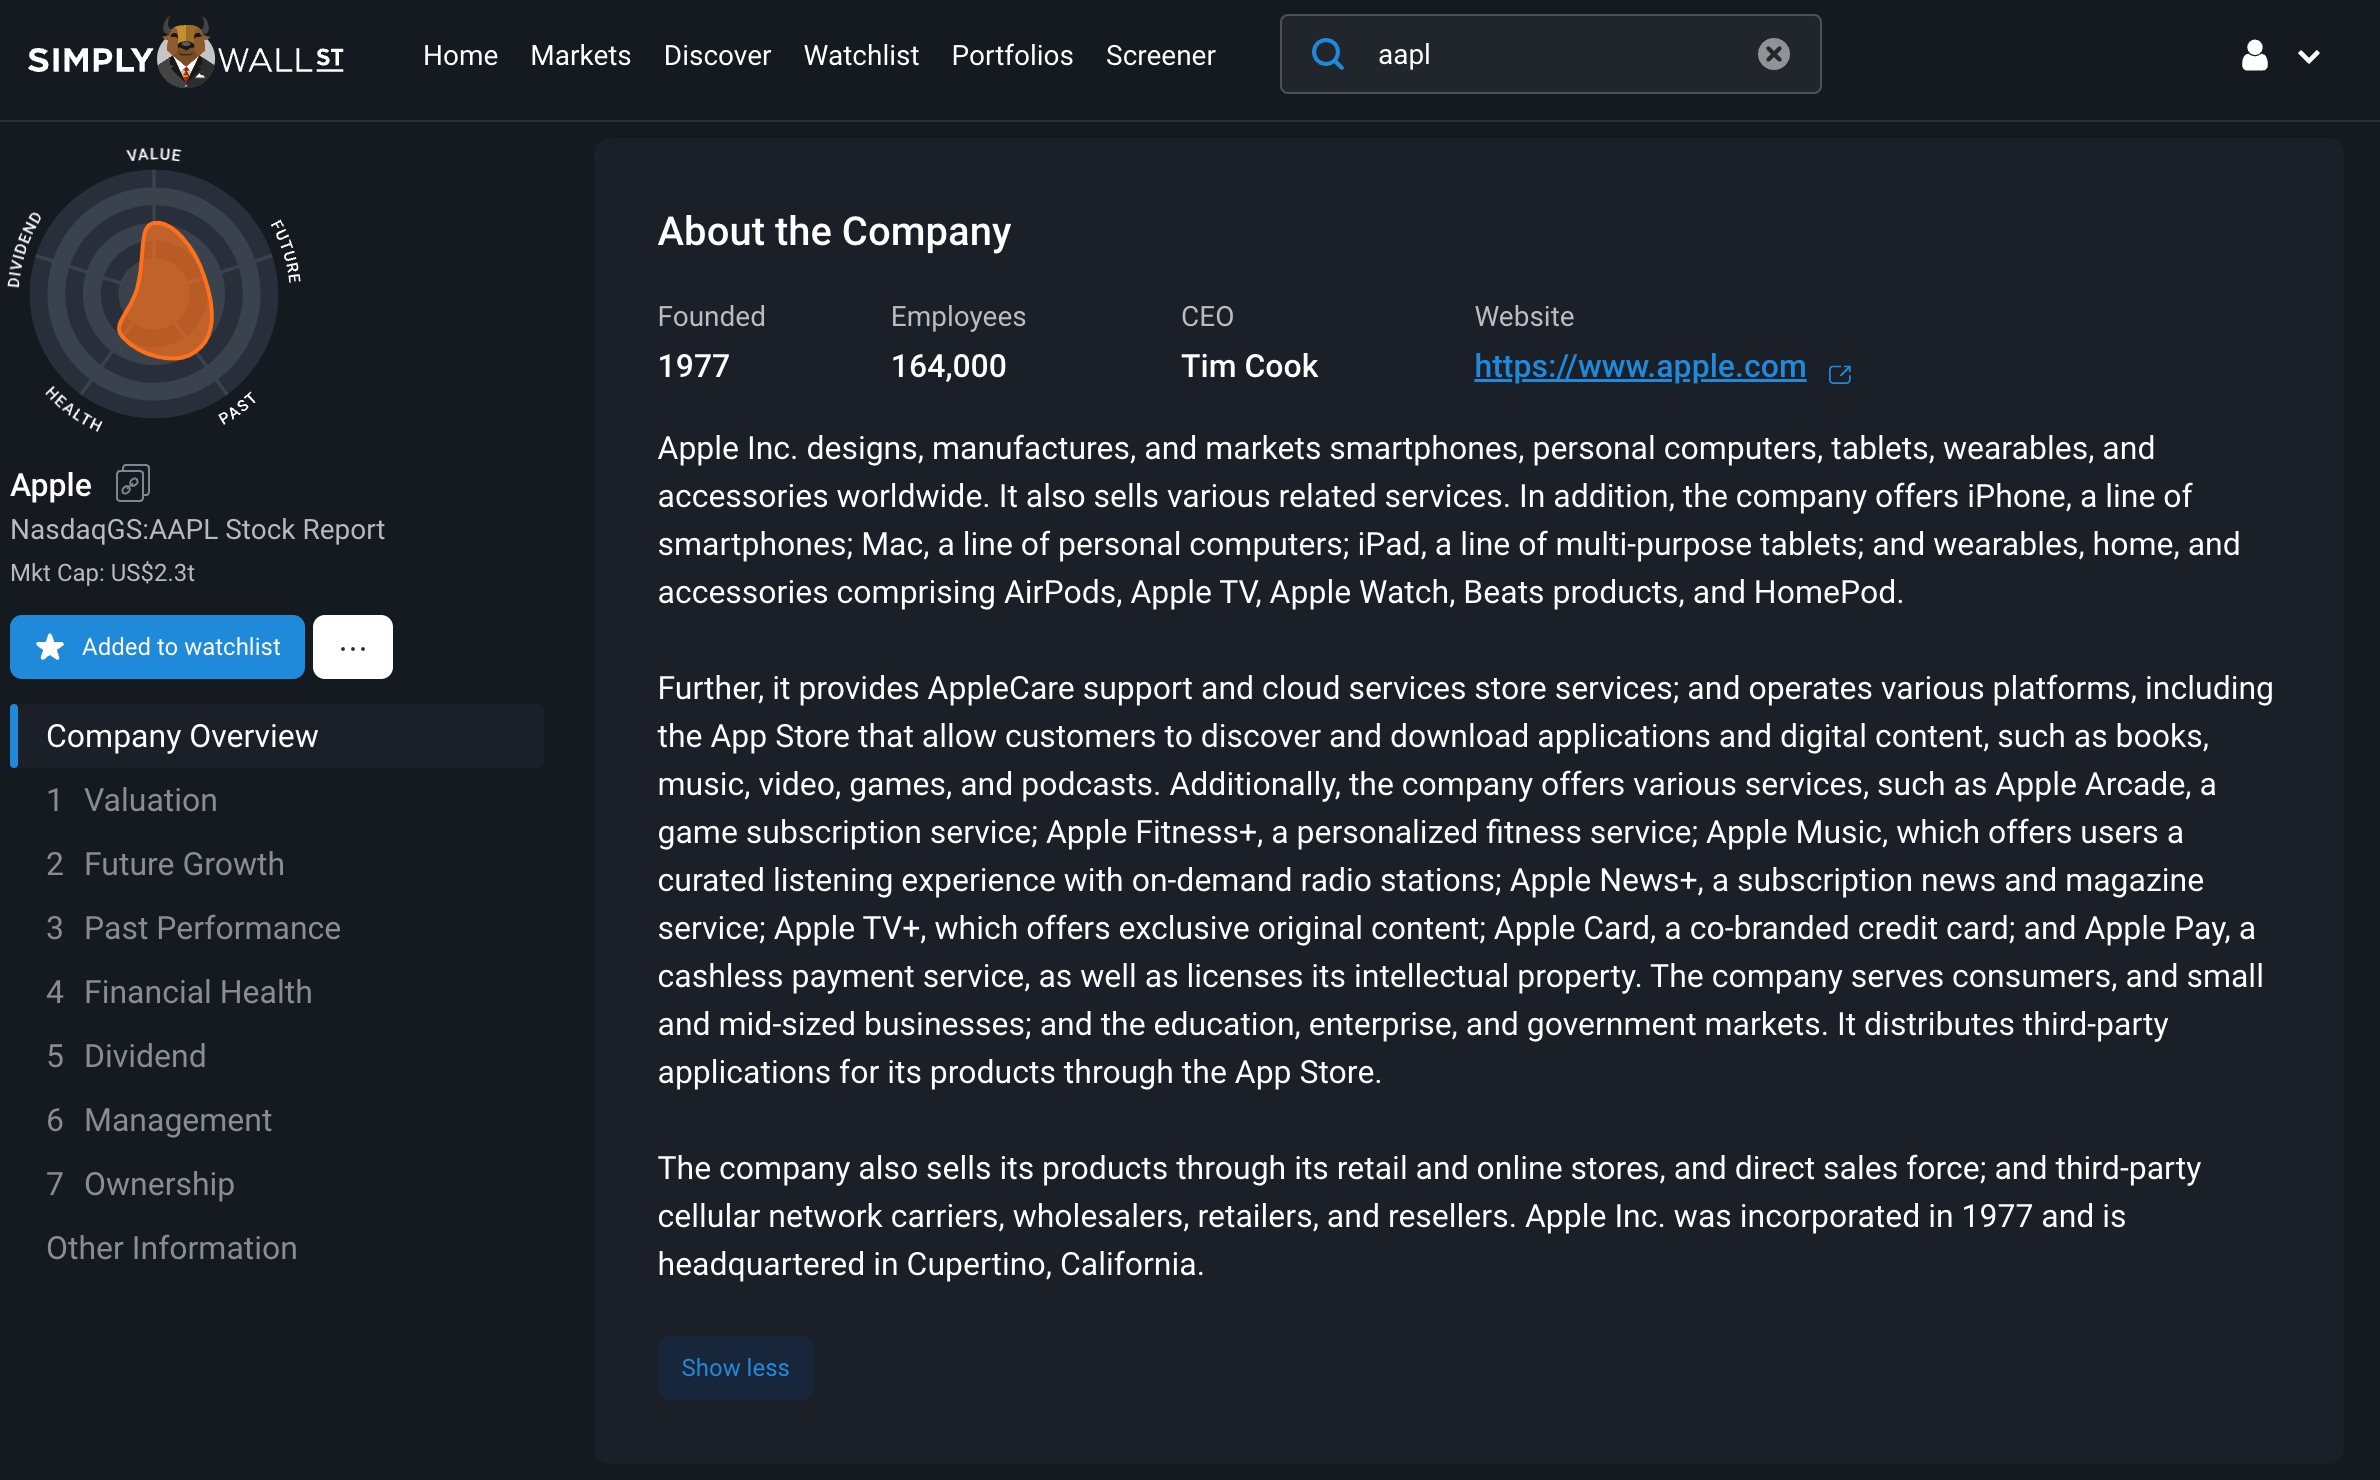
In this example above, we can learn a lot about Apple just from this text alone. If we have trouble understanding this section, there’s a good chance the business model may not be within our circle of competence, so keep that in mind.
To learn more about how the business spends money to make those sales, and how those sales are made of all its products and services, we need to dig a little deeper into our second option.
Before you run away, just hear us out! (We’ll only cover it in high level here, but we'll provide a more detailed explanation soon in another article if you’d like to learn more).
For the purposes of this series, we only need a few sections of the annual report since some parts of sections of it are well beyond the scope of this series.
While we’re focusing on U.S. stocks in these examples, other markets around the world follow relatively similar processes with their annual reports.
Now while that last one is a mouthful, these sections alone will give us a much more in-depth breakdown of the products and services that the business sells, as well as commentary on things like markets and distribution, competitors, supply of components, R&D, seasonality, risks, etc.

Reading through these 3 sections is a great way to get up to speed on the business if it’s your first time looking at it.
So when you’re ready for this step, have a read through those parts of the annual report on the stock (or stocks) you chose in Part 1 of this series.
Now that you’ve read those sections of the annual report, we’ll show you how they relate to what you’re seeing on the Simply Wall St company report, and what we can learn from them.
The Simply Wall St waterfall chart below shows us how the company's revenues turn into profits, and those sections from the annual report mentioned above provided us with some (more) colour to this already colourful chart.
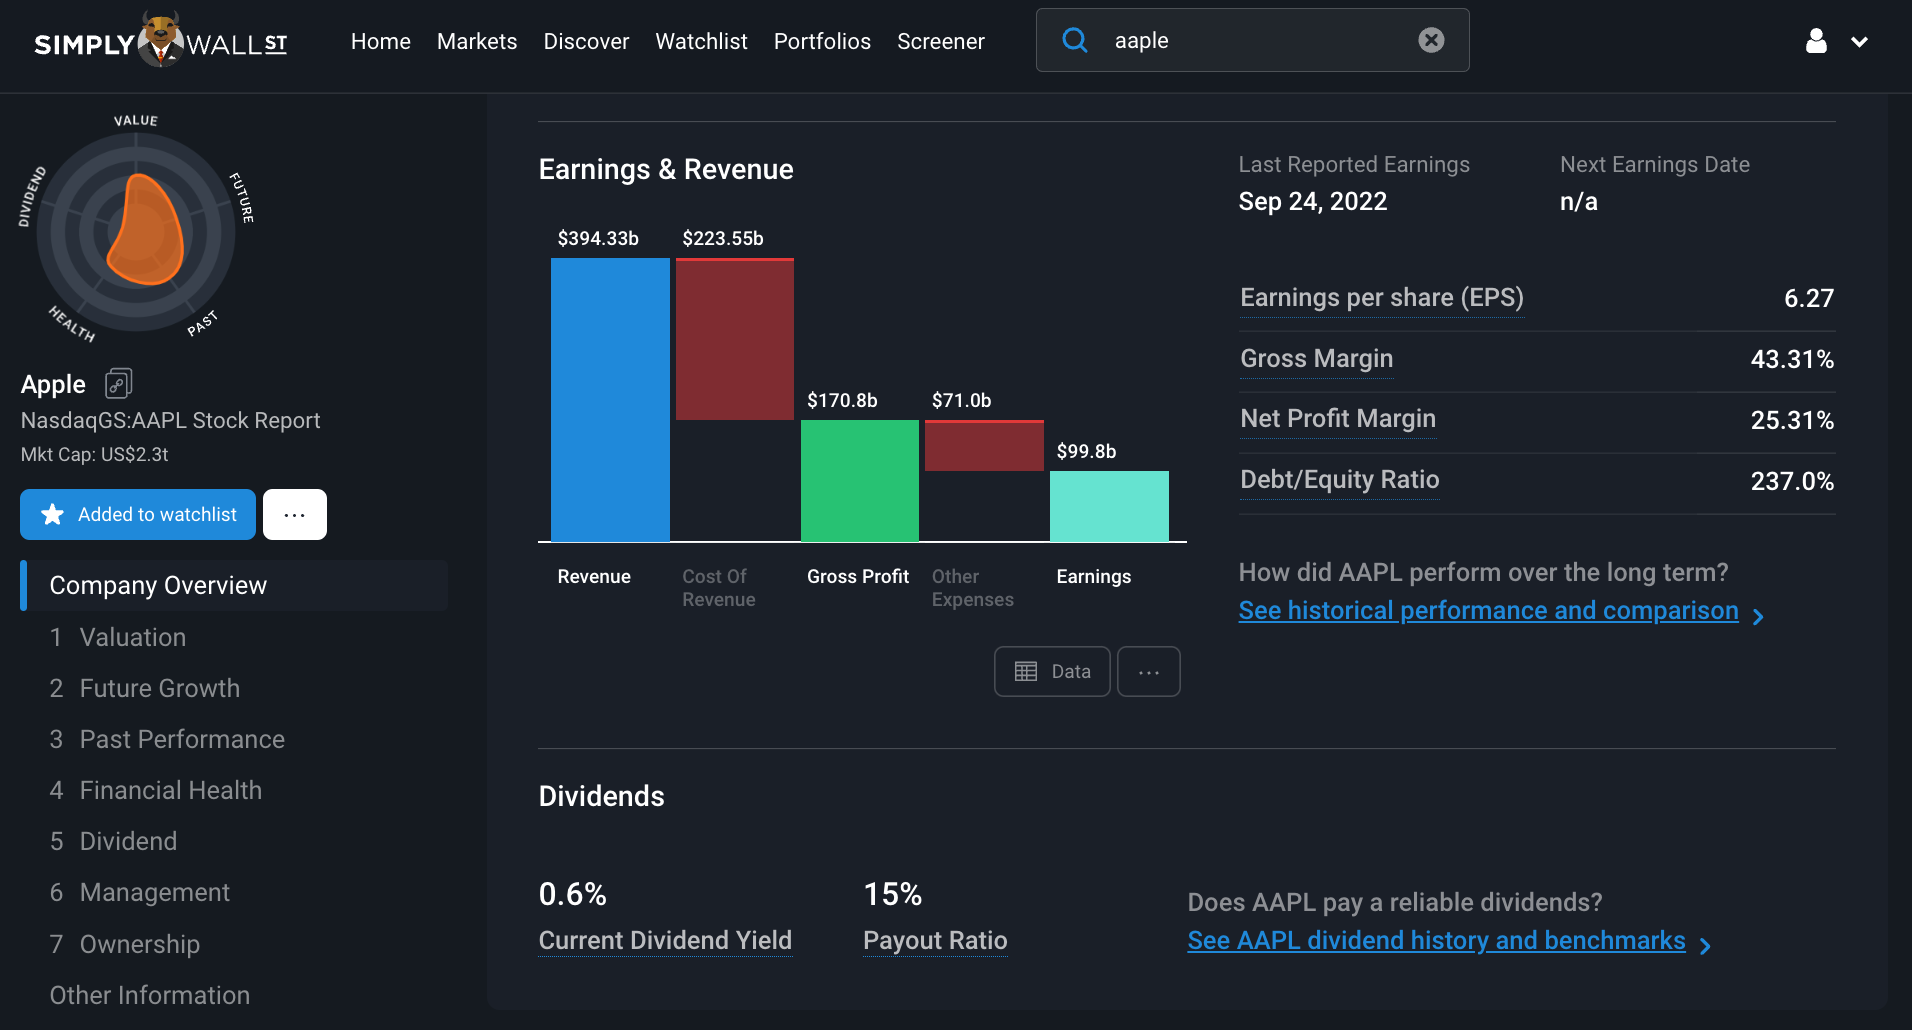
After reading those sections of the annual report, here’s what we learned about Apple:
That Revenue column ($394bn) is made up of sales from:
The Cost of revenue column ($224bn) is:
The Other Expenses column ($71bn) is made up 3 expenses:

So we’ve now learned that in order for Apple to sell all its products and services for $394bn, it spends $224bn to make the products and services (cost of revenue), then spends $71bn on improving those offerings (R&D), marketing them (Selling) and running its business (General and admin). Then it pays its income taxes and it’s left with $99bn in net profit!
Therefore Apple has a net profit margin of 25%, which is good! This tells us that for every $1 in sales, it has $0.25 left over in profit after it’s paid all its expenses.
And by looking at that waterfall chart in combination with the Annual report helping us, we got a great overview of the business in terms of how it makes money and spends money.
The reason we want to know all of this is because we need to think about what each of these items will be like in a few years time. How do they contribute to the narrative that I'm building?
Is there a noticeable trend occurring in revenue from each segment? Will these trends continue? Are net margins increasing as revenue growth outpaces expense growth (which is known as operating leverage)? Or is the company heavily reinvesting in itself, so expenses are growing as fast, or faster than revenues?
Important note: While all U.S. listed stocks follow a similar flow in their annual reports, they may not use the exact same wording, so you may need to use your own judgement in some areas. For example, “Cost of sales” can also be called “Cost of revenues”, or “Cost of Goods sold”.
Hot Tip: When you’re reading an annual report, Contrl+F on your keyboard is your best friend to find what you’re looking for. And for now, stick to those 3 sections mentioned above.
Next, we need to think about competitors, because that’ll help us understand if there’s a better opportunity out there, or if the stock we’re looking at faces any risks from them.
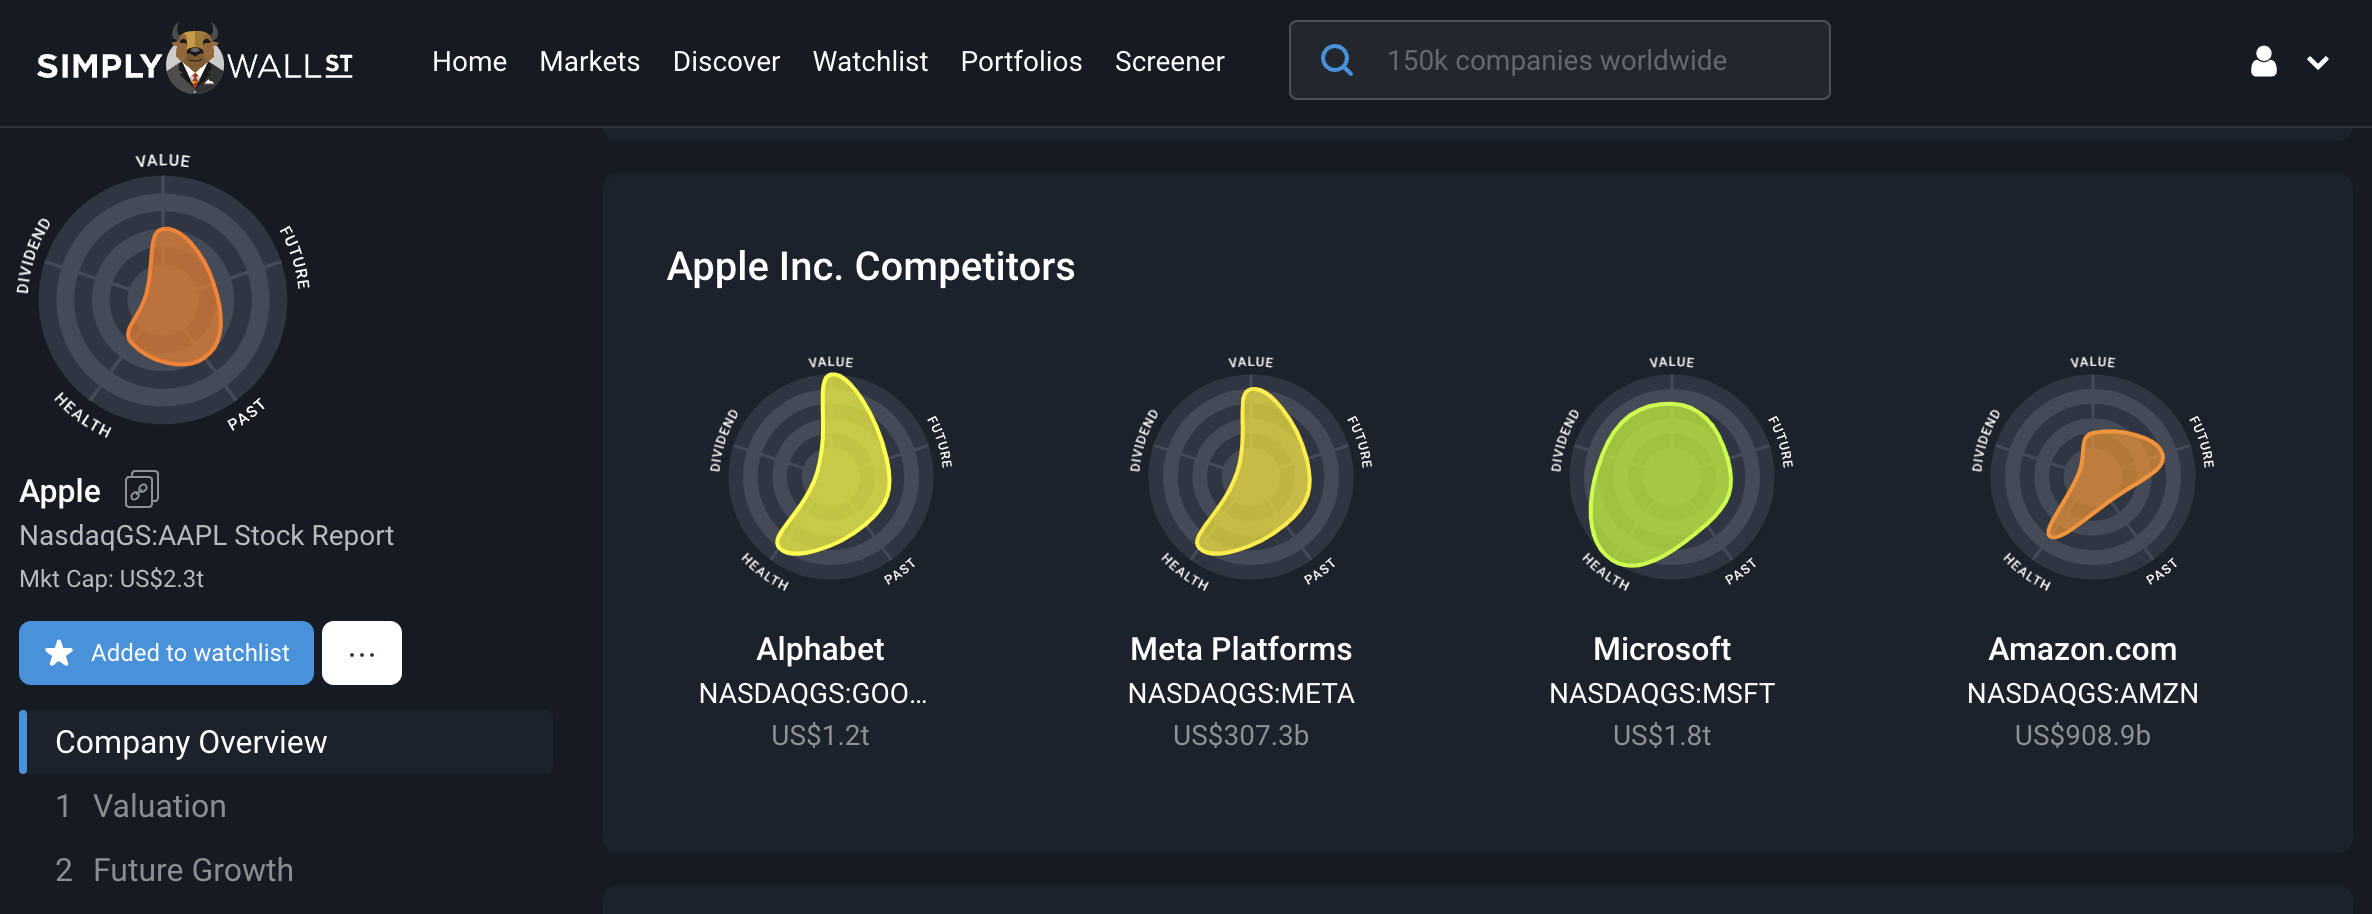
If you’re already familiar with the products/services, you should hopefully have a good idea of the competitors. So if you bought an iPhone or Macbook, you knew what the alternative smartphone and laptop options were out there that you didn’t go with.
So for listing out competitors, you can generally start from your existing knowledge by adding in who you already know are competitors. If the business operates in multiple industries, it’s worthwhile adding all the different types of competitors they’re up against.
Once you’ve done that, put some thought into what makes the offerings from the business you’ve chosen, different to those competitors. Ideally, you’ve already got a rough idea because you probably chose this product or service over its competitors for some reason that was important to you (cheaper price, better quality, brand image, better service, etc).
This is also why we start within our circle of competence, because you’ve already done a lot of this hard work and you’re familiar with the product or service, and what makes it special.
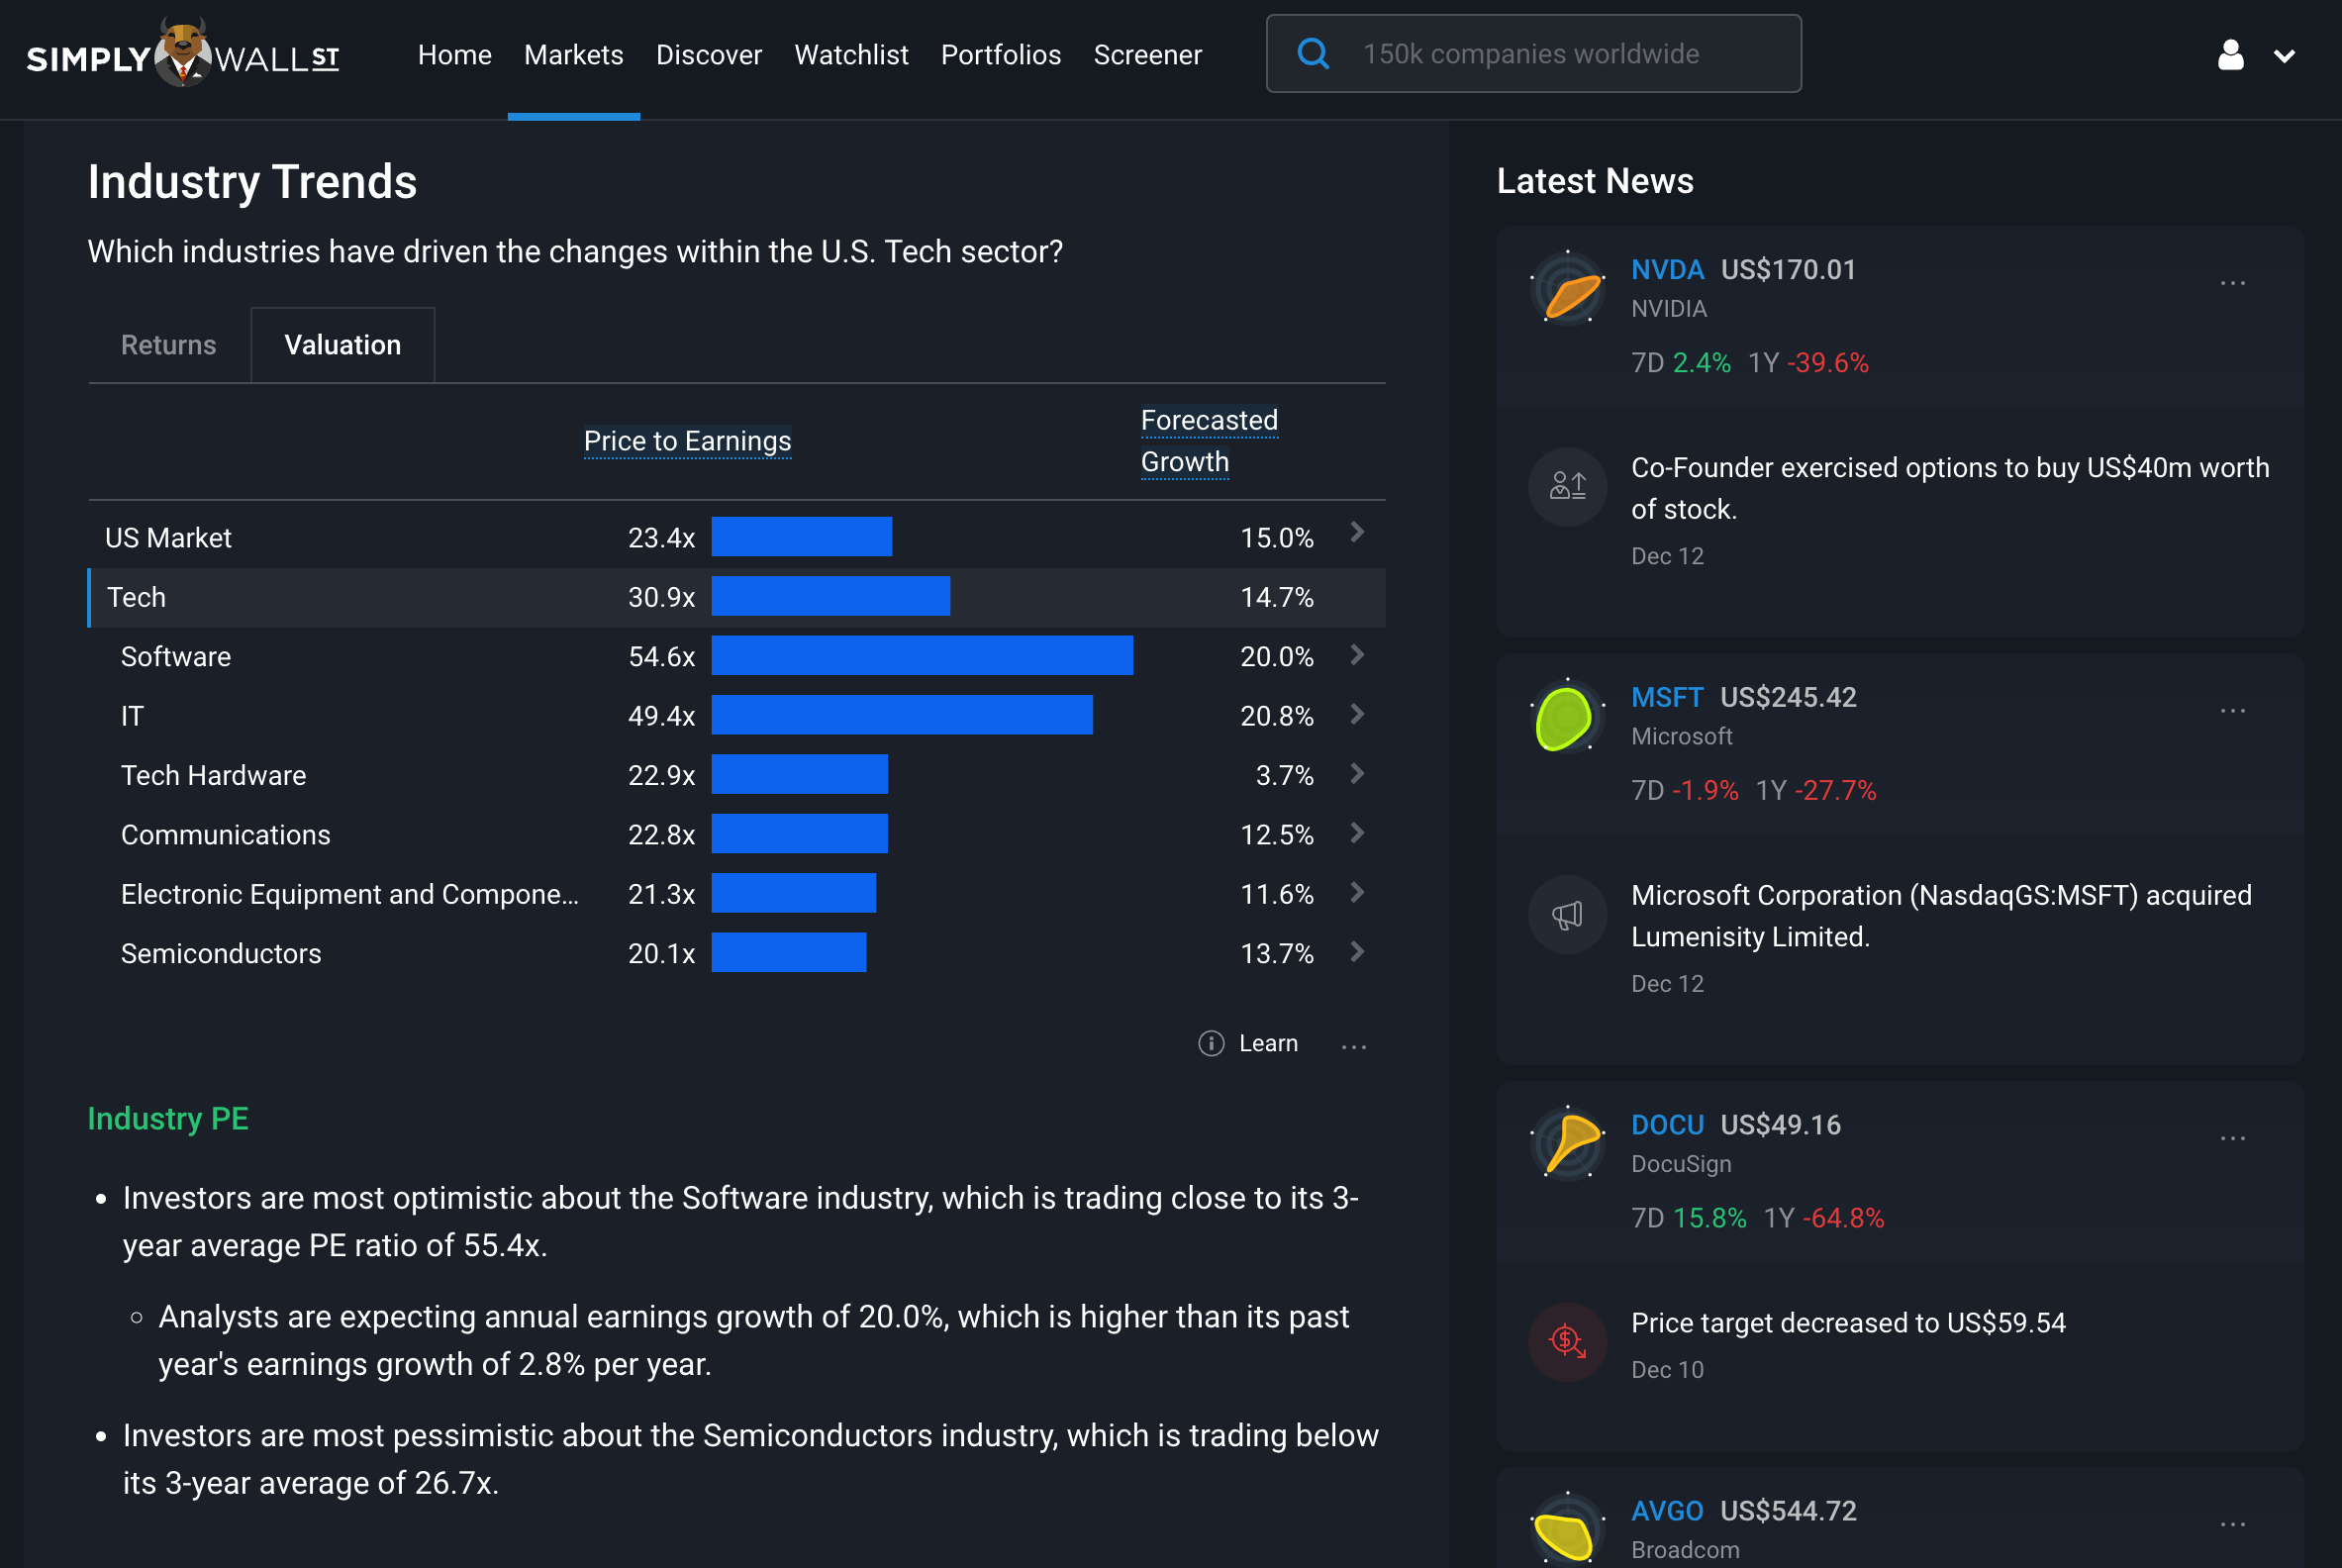
In order to get to know the industry and its prospects, we can simply click the Industry name at the top of the company report (For Apple, it says: Stocks / United States / Tech )
From there, we read through the analysis to understand the industry's past performance and future prospects, as well as if there are any opportunities or risks present. The Simply Wall St Markets and Industry pages give us an overview of current valuation and past performance, industry trends and future growth expectations for the industry and its sub-sectors. We can read external industry reports to get more details as well.
So, since you hopefully already chosen a few stocks in Part 1, go ahead and do this for each stock:
Here’s the example we did for Apple:
Now that we know the business, in the next part of this series, we’re going to get to know the stock in Part 3!
Also, if you’d like access to the SWS Investment checklist , you can access it ahead of time to see what you’ll be using when you’re done!
Lastly, if you've finished the How to Invest like the Best series, we'd love to hear your feedback!
Simply Wall St analyst Michael Paige holds a long position in AAPL. Simply Wall St has no position in any of the companies mentioned. This article is general in nature. Any comments below from SWS employees are their opinions only, should not be taken as financial advice and may not represent the views of Simply Wall St. Unless otherwise advised, SWS employees providing commentary do not own a position in any company mentioned in the article or in their comments. We provide analysis based on historical data and analyst forecasts only using an unbiased methodology and our articles are not intended to be financial advice. It does not constitute a recommendation to buy or sell any stock and does not take account of your objectives, or your financial situation. We aim to bring you long-term focused analysis driven by fundamental data. Note that our analysis may not factor in the latest price-sensitive company announcements or qualitative material.


Level 5, 320 Pitt Street, Sydney


Financial Data provided by S&P Global Market Intelligence LLC, analysis provided by Simply Wall Street Pty Ltd. Copyright © 2023, S&P Global Market Intelligence LLC. All rights reserved.