Price and Value: Knowing the difference

Now that we’ve learned about the business and the fundamentals of the stock, let’s see if the stock is potentially overvalued or undervalued! We’re going to look at:
You'll be walking through the valuation section with your own stock that you chose earlier in this series.
We’re going to continue with the worksheet we had in Part 3, and just fill in the last row of this table based on what we learn.

The “value” of a business is the present value of all the future cash that it will generate for shareholders over its remaining life.
The thing is, every investor has different opinions on the future. So typically, no two investors have the same estimate of the value of a stock. That’s why valuing a stock is an imprecise art and science .
When you see a stock priced at $100m on the stock market, that is the market (i.e. investors in general) telling you that they believe all the future profits it will generate are worth $100m today. Now since the future is uncertain and everyone has their own opinions and assumptions about what’s going to happen, not all investors will agree with that $100m.
That $100m is just the current price . The value could be very different depending on your assumptions and opinions of the future.
For example, if the market expects a stock to grow its earnings by 10% per year for the next few years, but you think 15% is more likely based on your research and assumptions of the future, then you’d think the current price is cheap or “undervalued” (because it’s currently priced as though it’s going to grow its earnings by 10% per year).
Conversely, if you think 5% growth per year is more likely, rather than 10% per year, you’d think today’s price is a bit high or that it’s overvalued.
There are many ways you can value a business. You can compare it to other businesses (relative analysis) or assess its future prospects by itself (intrinsic value). Simply Wall St’s valuation analysis does both.
So when we use multiple approaches to value a stock, and come to similar conclusions with each check (i.e. over or undervalued), we can have a bit more conviction in our assessment knowing that we used multiple methods and reached similar conclusions.
So now let’s go through an example with Apple on Simply Wall St’s 6 step valuation analysis, and see what we come to at the end.
Overall we simply want to see if:
When we look at the Price to Earnings Ratio vs Peers chart, we basically just want to look for stocks that provide a good combination of low price and high growth.
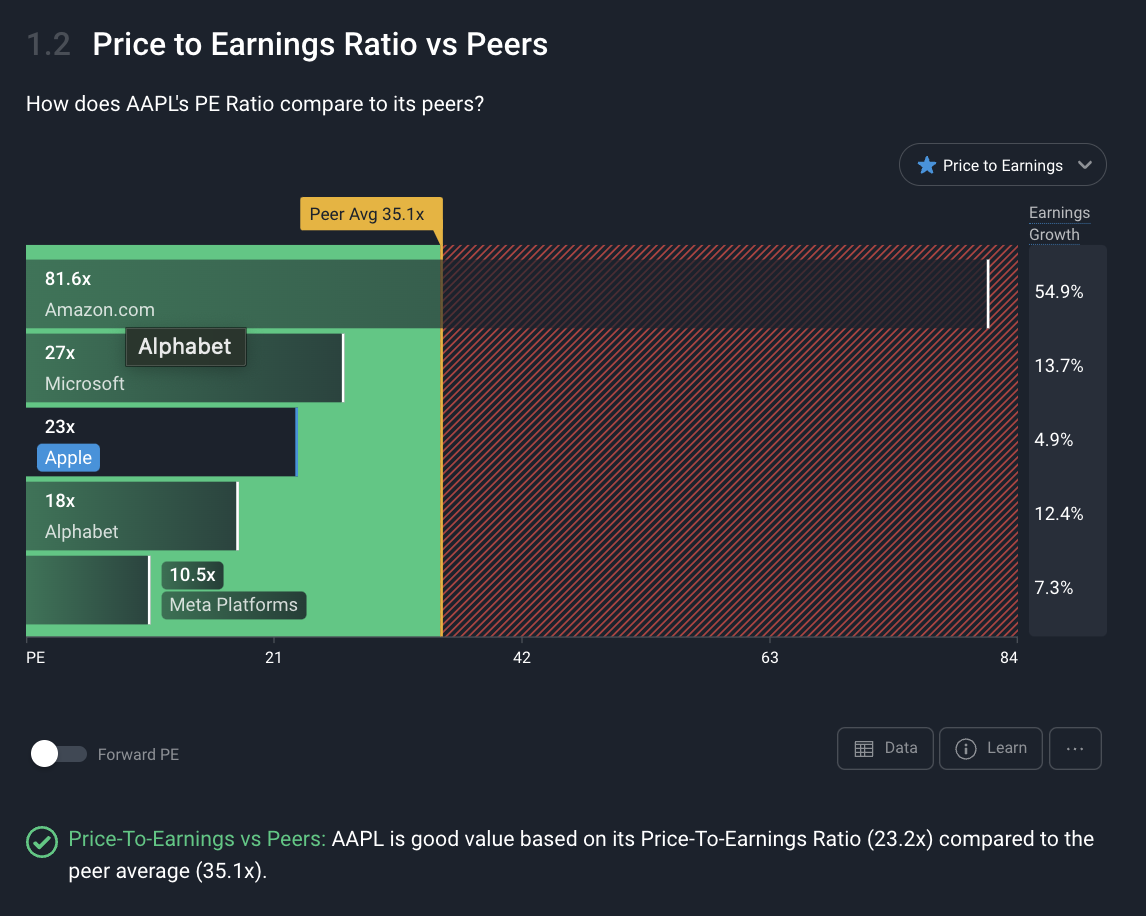
Looking at Apple in the above chart, it looks like Apple may not provide the best combination of low price and high growth. Alphabet seems to be priced lower than Apple, yet is expected to grow its earnings more than 2x faster than Apple. That seems pretty appealing on a relative basis.
Also, it seems like Amazon is skewing the average peers PE ratio higher because of its high PE ratio. So while the company passes this check for its relatively low PE ratio, we need to keep in mind the growth rates on the far right of that chart, because they add valuable context to the price we’re paying.
Next we’re going to look at a how our stock compares to a wider group of companies, in this case, the Global Tech hardware industry. We'll have a look to see if there's better opportunities out there that are lower priced with the same growth rates, or stocks with higher expected growth for the same price.
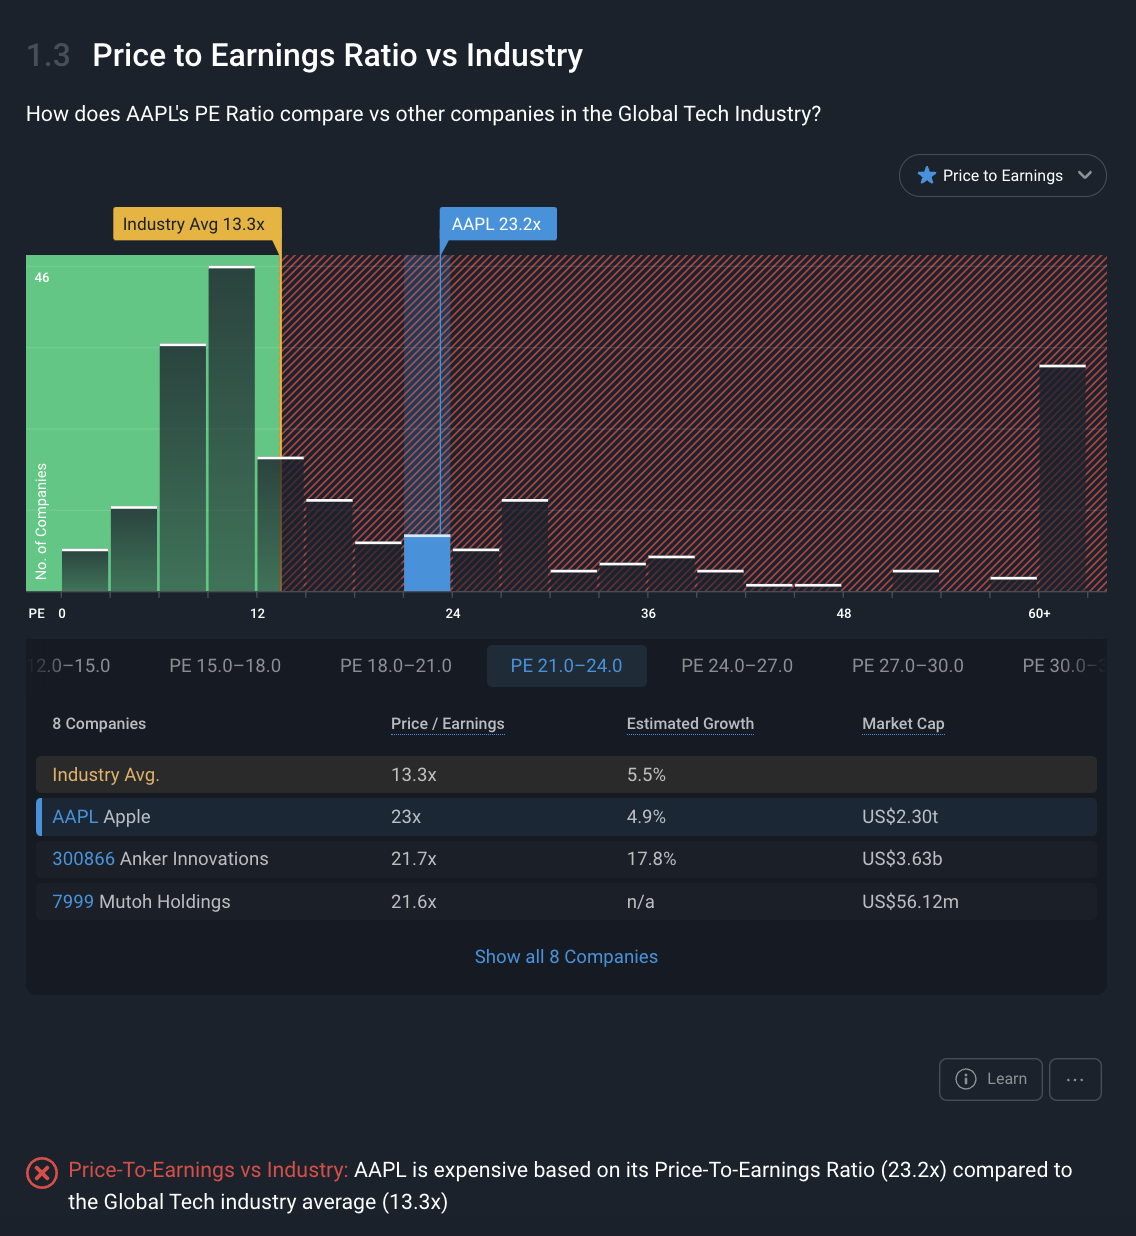
It looks like Apple is almost double the global industry average PE. Additionally, having clicked on those other PE ranges (like 18-21x, and 24-27x), it seems like there are companies with similar prices, but some have much higher expected growth rates.
This tells us that Apple might be expensive considering its lower growth prospects , but also that investors appear willing to pay a higher price for Apple, which may be simply because it's such a dominant player in the market.
Now we want to assess how the market is valuing this stock compared to stocks with similar characteristics.
Simply Wall St’s Fair ratio is calculated using thousands of data points from companies with similar market capitalizations, profit margins, growth rates, risks, etc to understand how the market is valuing those companies with similar metrics.
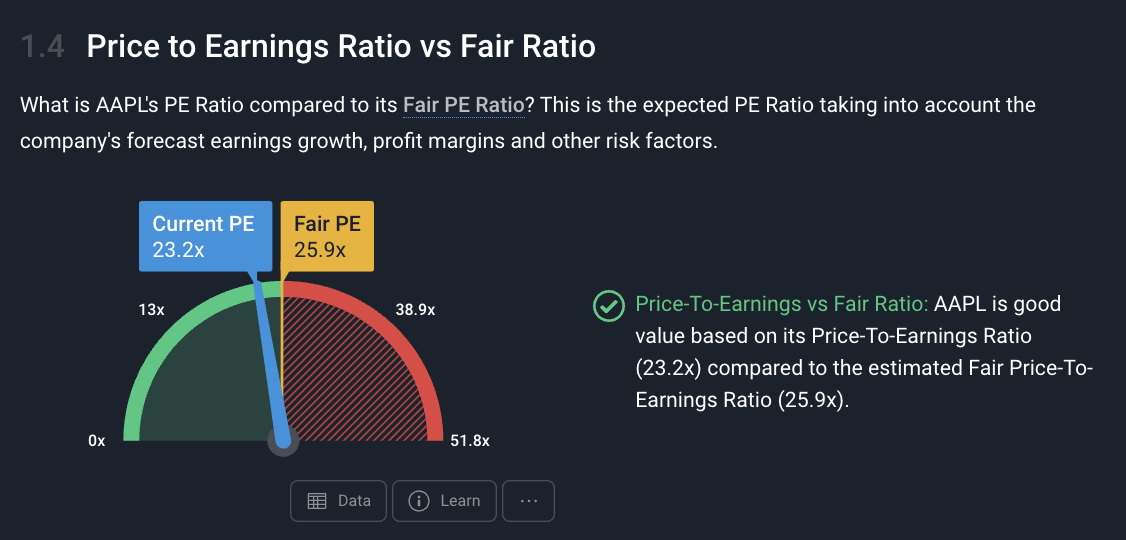
When we look at Apple against its fair ratio, it seems that it could be priced about 11% higher based on how companies with similar metrics are valued.
So the takeaway here is that it could have a little bit of upside potential, but only if it's re-priced by the market to what companies with similar traits are priced at.
We’ve done relative valuations in the past few checks, now it’s time to assess Apple by itself in terms of intrinsic valuation .
For these next two checks, we simply want to see:
This estimate of fair value is based on forecasts from analysts, and a few other assumptions. It is not a buy or sell recommendation, but a useful estimate of what a stock could be worth based on a few different estimates and inputs.
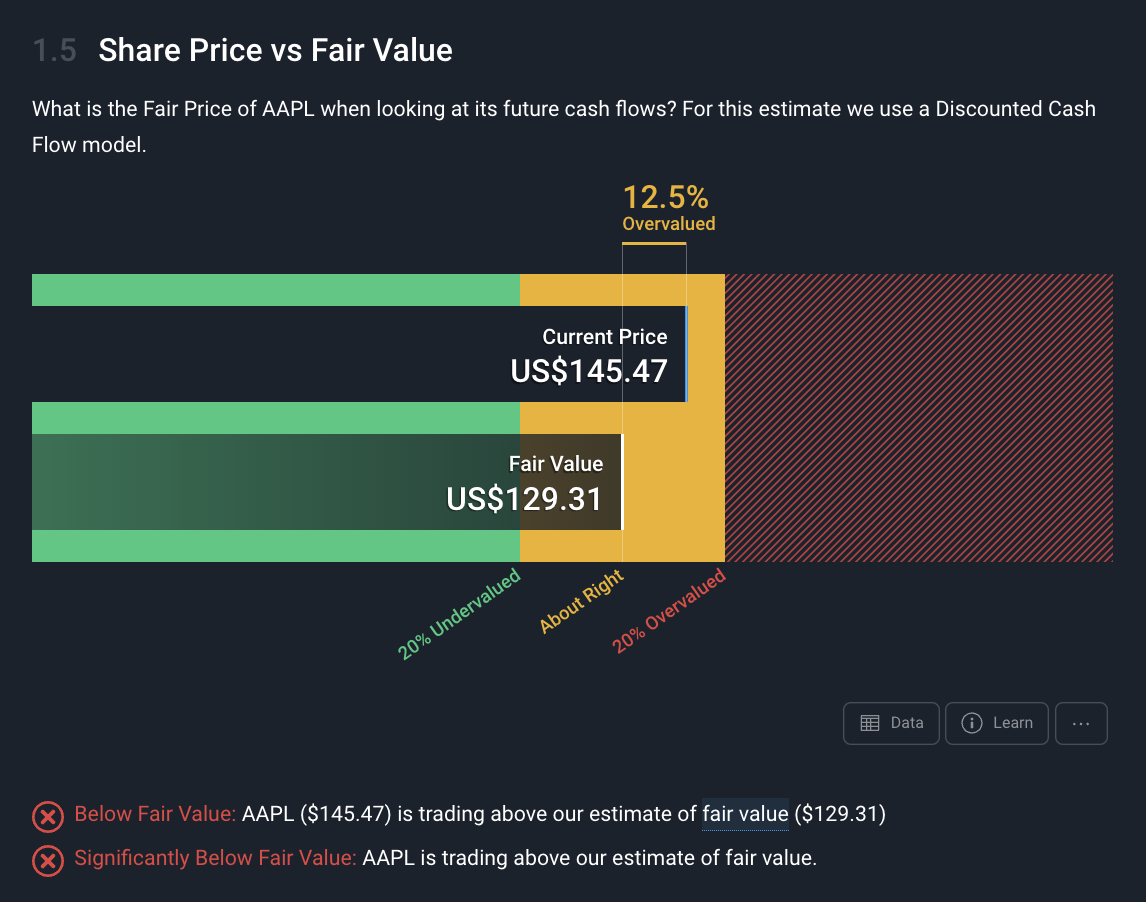
The fair value estimate here is at $129, while the stock is currently trading at $145. Therefore, it doesn’t pass either of these checks and appears to be fairly valued right now.
As we said, this fair value is an estimate with certain assumptions and inputs. So to see what these are, we can click the Data button below the chart, and scroll through all the calculations.
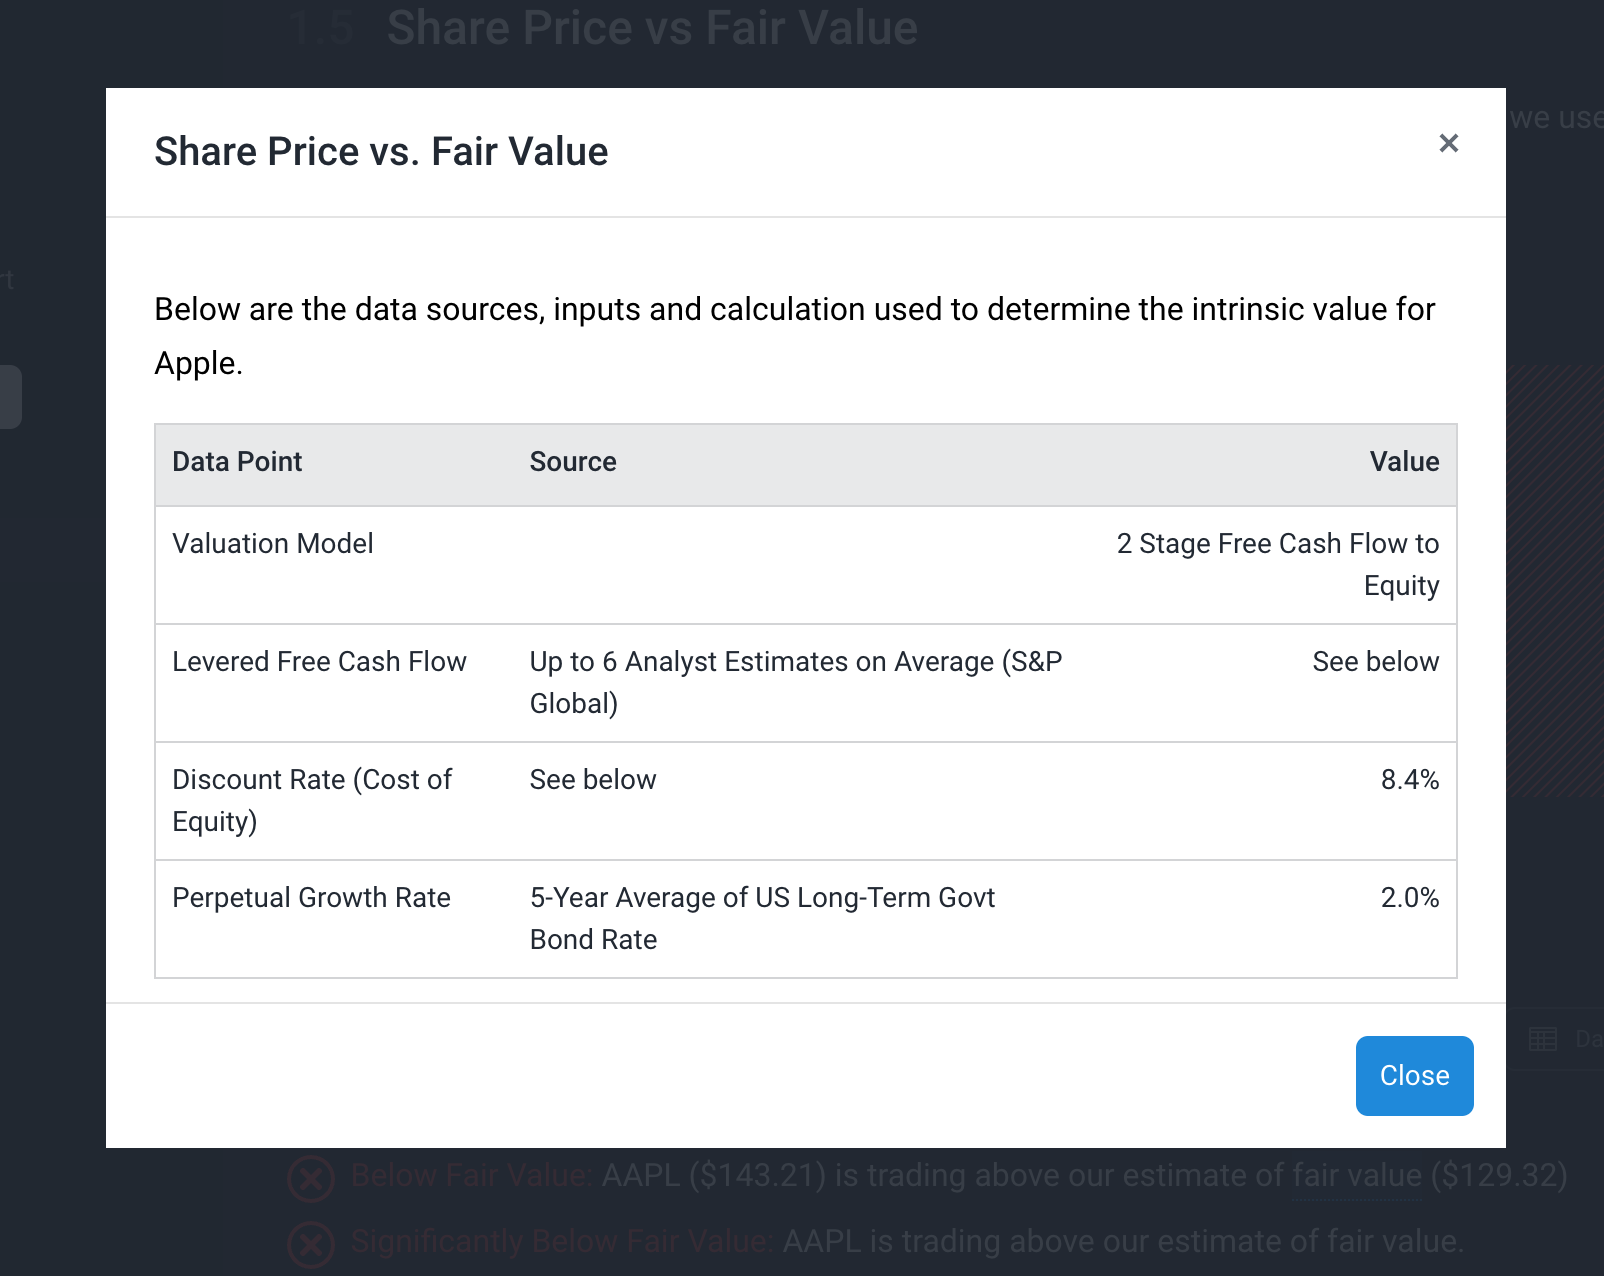
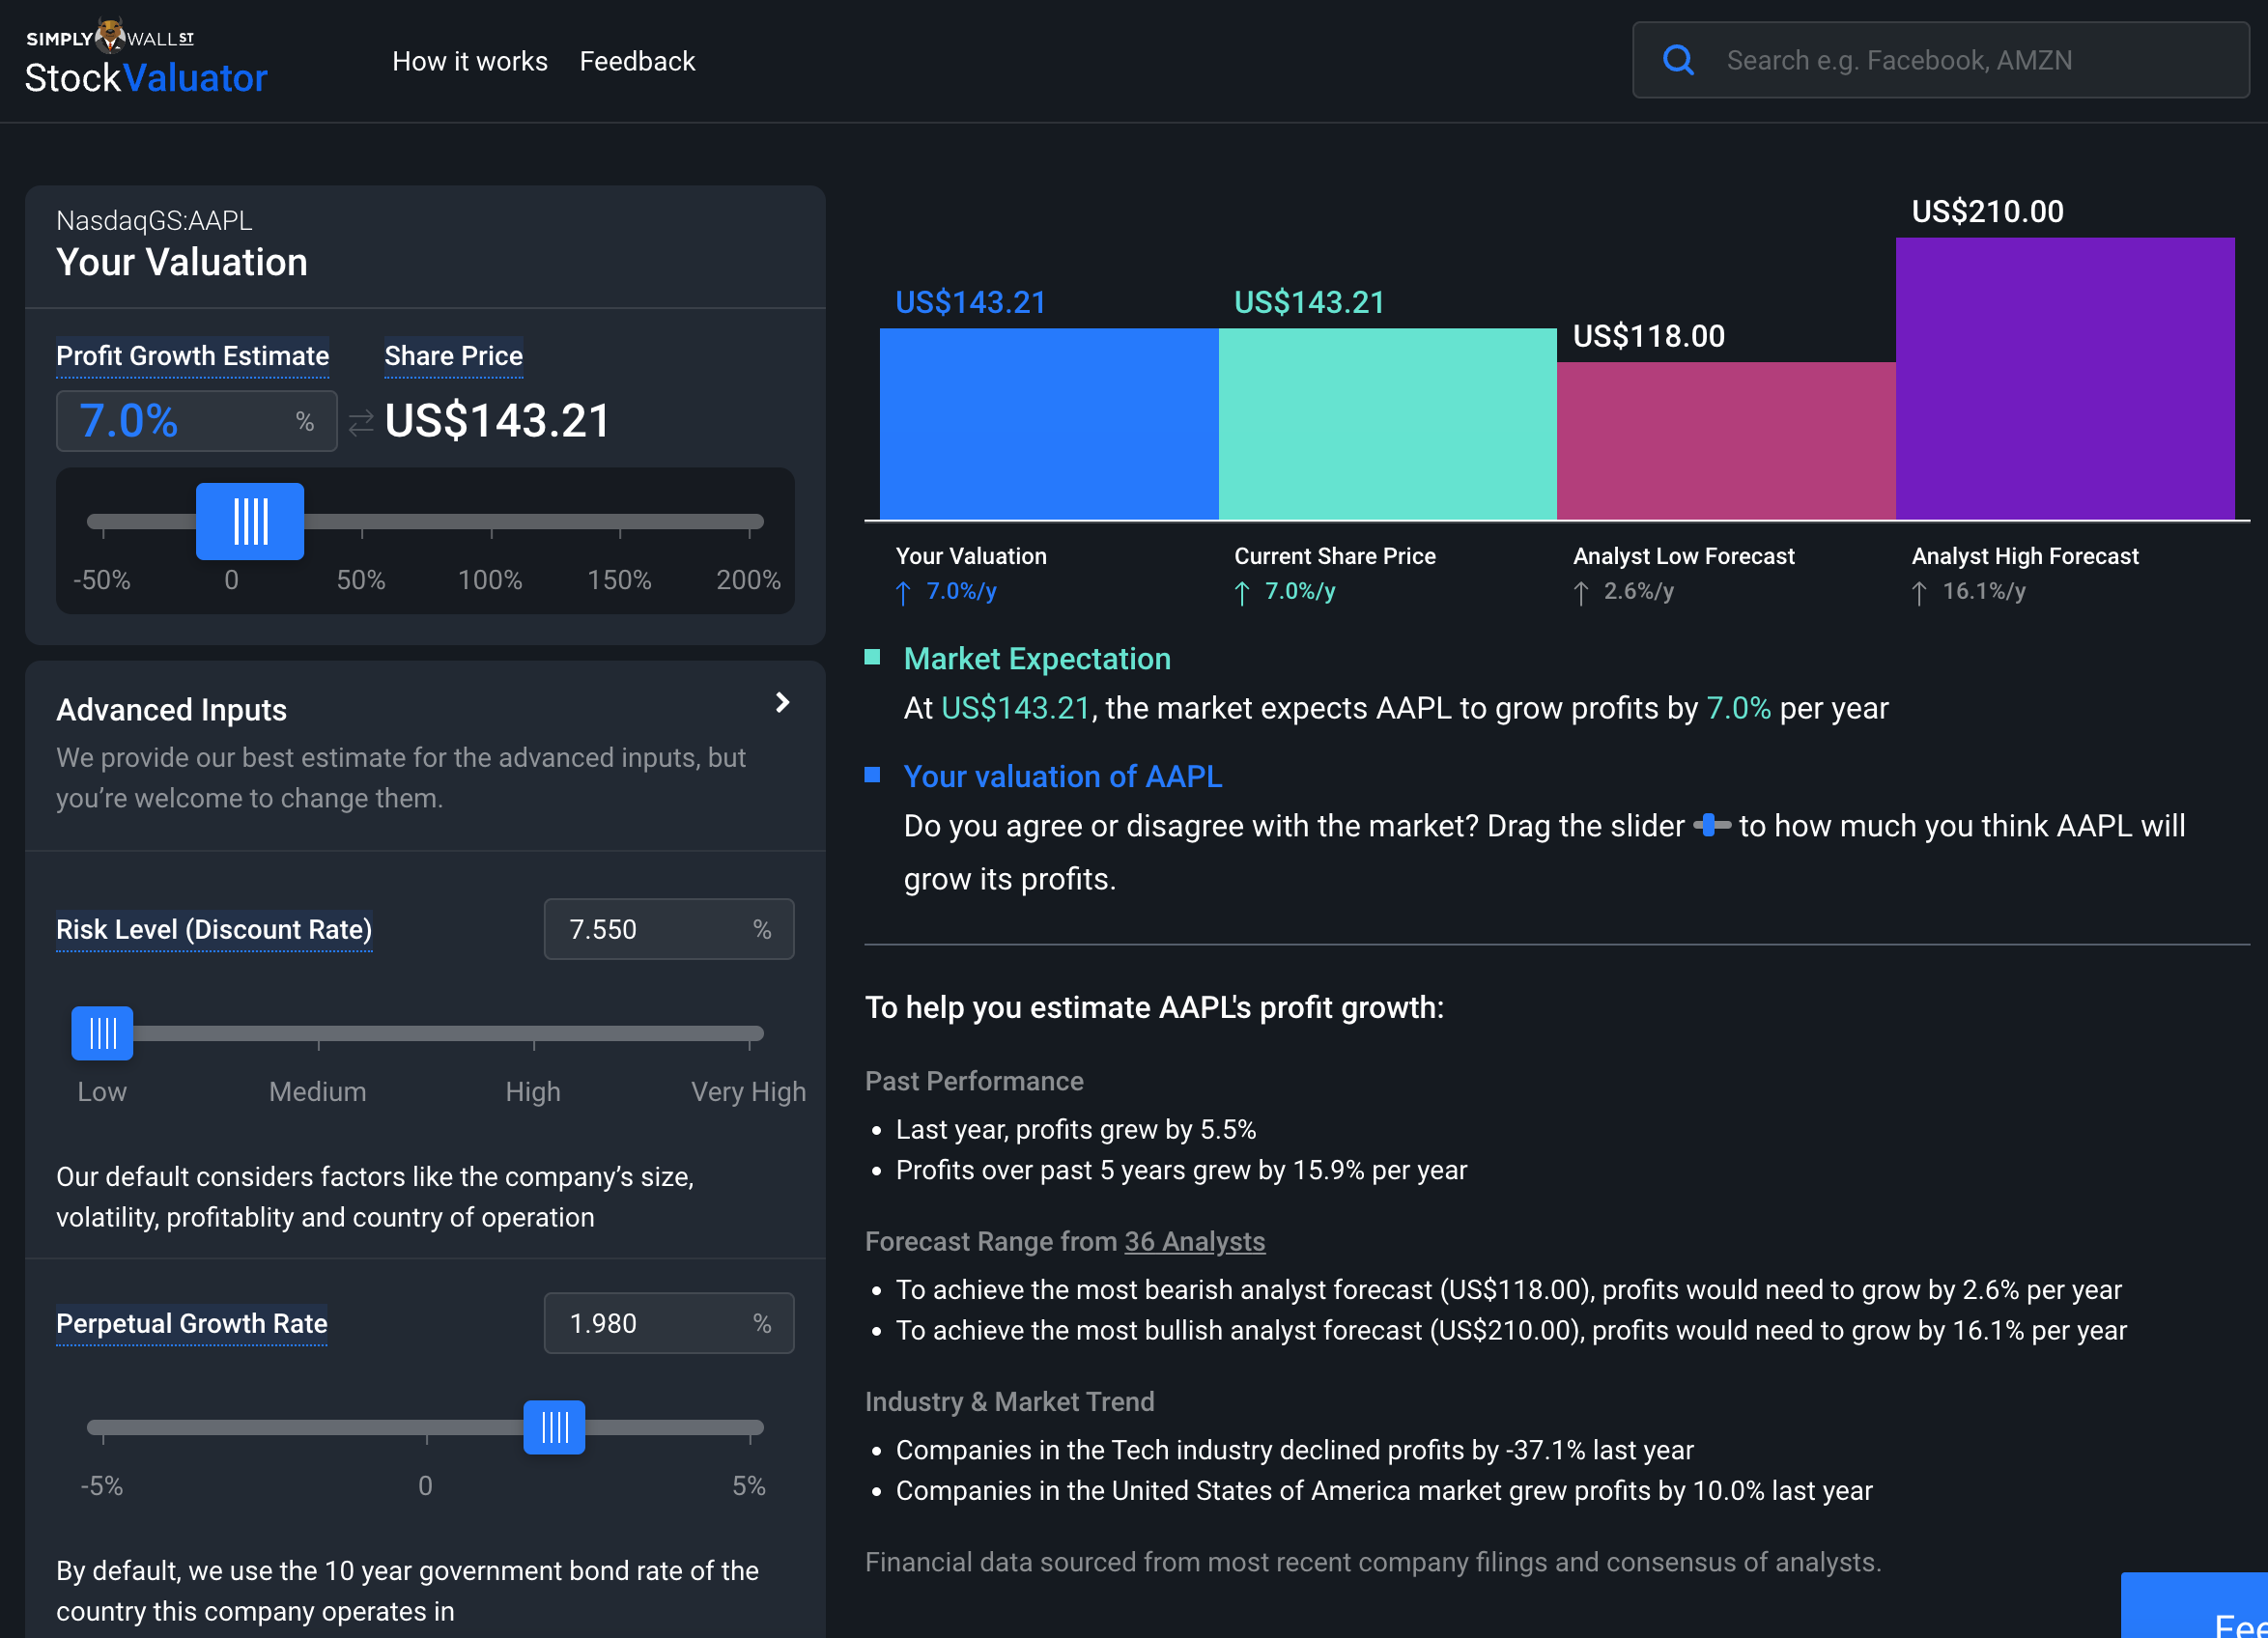
Some more experienced investors might disagree with these assumptions or inputs based on their own research and want to change them (say with higher or lower growth rates, and/or higher or lower discount rates, etc), which is totally fine! In fact, if you want to change the inputs yourself, we have a Stock Valuator tool currently in beta where you can do exactly that.
If you’re not at that stage where you feel confident changing the inputs, it’s ok to simply take the fair value estimate checks, and look at them in conjunction with the other checks done throughout the valuation section.
In this example, your conclusion might be that Apple appears to be fairly valued right now, considering it’s trading pretty close to the fair value estimate.
Lastly, for this final part of analysis, we simply want to see:
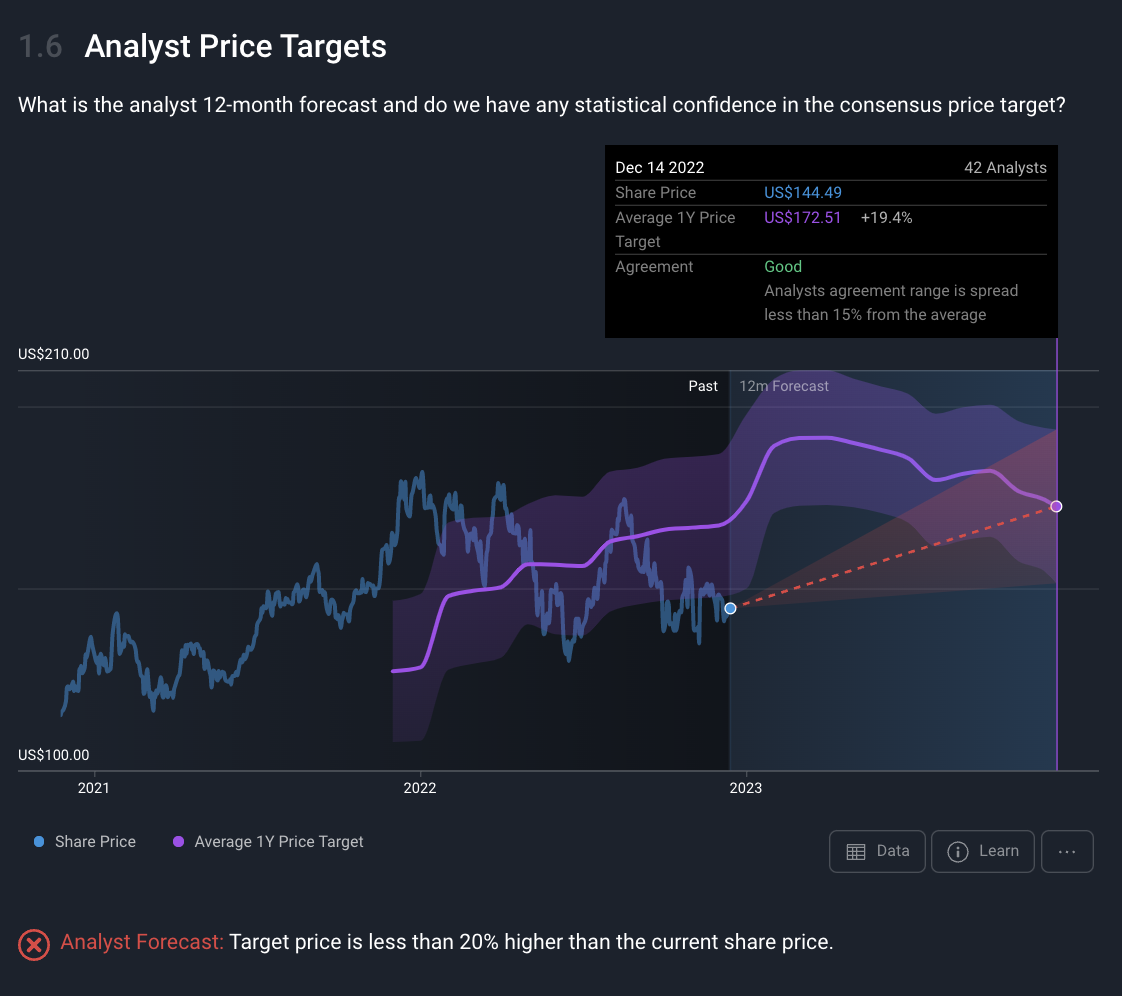
From looking at the above chart, it seems like analysts largely agree (because “Agreement” reads “good) that there’s potentially 18% of upside for Apple over the next year. A possible 18% upside over one year seems pretty good, but is it enough upside to justify investing in it (given the downside risks as well)?
We’d be more interested if it was well above 20%, so in this case, it doesn’t seem like a huge opportunity over the next year. Also, there are some outlier price targets, with low targets of $118 to a high target of $210. Depending on our assumptions of the future (if we assume more or less than 5% annual earnings growth), some of these price targets will make more sense to us than others, and that’s for us to decide.
If we think that 10% earnings growth is more likely (because of say growth in iPhone, Mac and Services sales), then the $210 Price target might make sense to us, which indicates 44% upside!
Alternatively, if we think its earnings growth is going to be flat, or even decline over the next year (which we saw some analysts think is likely in the EPS chart from Future Growth), then the $118 price target might make more sense to us, which means there’s 18% downside potential!
So from all that, the takeaways appears to be:

With all of that in mind, it's hard to have a huge degree of conviction in either buy or sell signals since we're getting mixed results from the different pieces of analysis. Which is totally fine, but we're not finished just yet...
Now that we’ve assessed Apple’s valuation, and got to know the stock, and the business, it’s time to bring our narrative together in Part 5 of this series, and then discuss how to know wheterh we should buy, sell or hold! So with whatever stock you’ve brought through with this series, you should be at that same spot and ready to compile your narrative together in the next piece! If you’ve missed any steps, feel free to go back to Part 1 , Part 2 or Part 3 so that you’re ready for Part 5 - Building your narrative around a stock, and knowing when to buy.
Lastly, if you've finished the How to Invest like the Best series, we'd love to hear your feedback!
Simply Wall St analyst Michael Paige holds a long position in AAPL. Simply Wall St has no position in any of the companies mentioned. This article is general in nature. Any comments below from SWS employees are their opinions only, should not be taken as financial advice and may not represent the views of Simply Wall St. Unless otherwise advised, SWS employees providing commentary do not own a position in any company mentioned in the article or in their comments. We provide analysis based on historical data and analyst forecasts only using an unbiased methodology and our articles are not intended to be financial advice. It does not constitute a recommendation to buy or sell any stock and does not take account of your objectives, or your financial situation. We aim to bring you long-term focused analysis driven by fundamental data. Note that our analysis may not factor in the latest price-sensitive company announcements or qualitative material.


Level 5, 320 Pitt Street, Sydney


Financial Data provided by S&P Global Market Intelligence LLC, analysis provided by Simply Wall Street Pty Ltd. Copyright © 2023, S&P Global Market Intelligence LLC. All rights reserved.