Get to Know the Stock

Now we get to dig into the Simply Wall St Company report. We’re going to cover sections 2-7, and leave section 1 (Valuation) to the next part of this series.
As we read through each part of the report, we’ll take notes on the strengths and weaknesses of the stock in this table below, according to the analysis that Simply Wall St does. By the end of this article, you’ll see the below table completed.

With the Future Growth section, we simply want to see:
This first chart, Earnings and Revenue Growth Forecasts shows us how much the company is expected to grow in the future (according to analysts expectations). This gives us useful context into how much we should pay (because investors pay a higher price for more future growth). But we’ll get into that in Part 4.
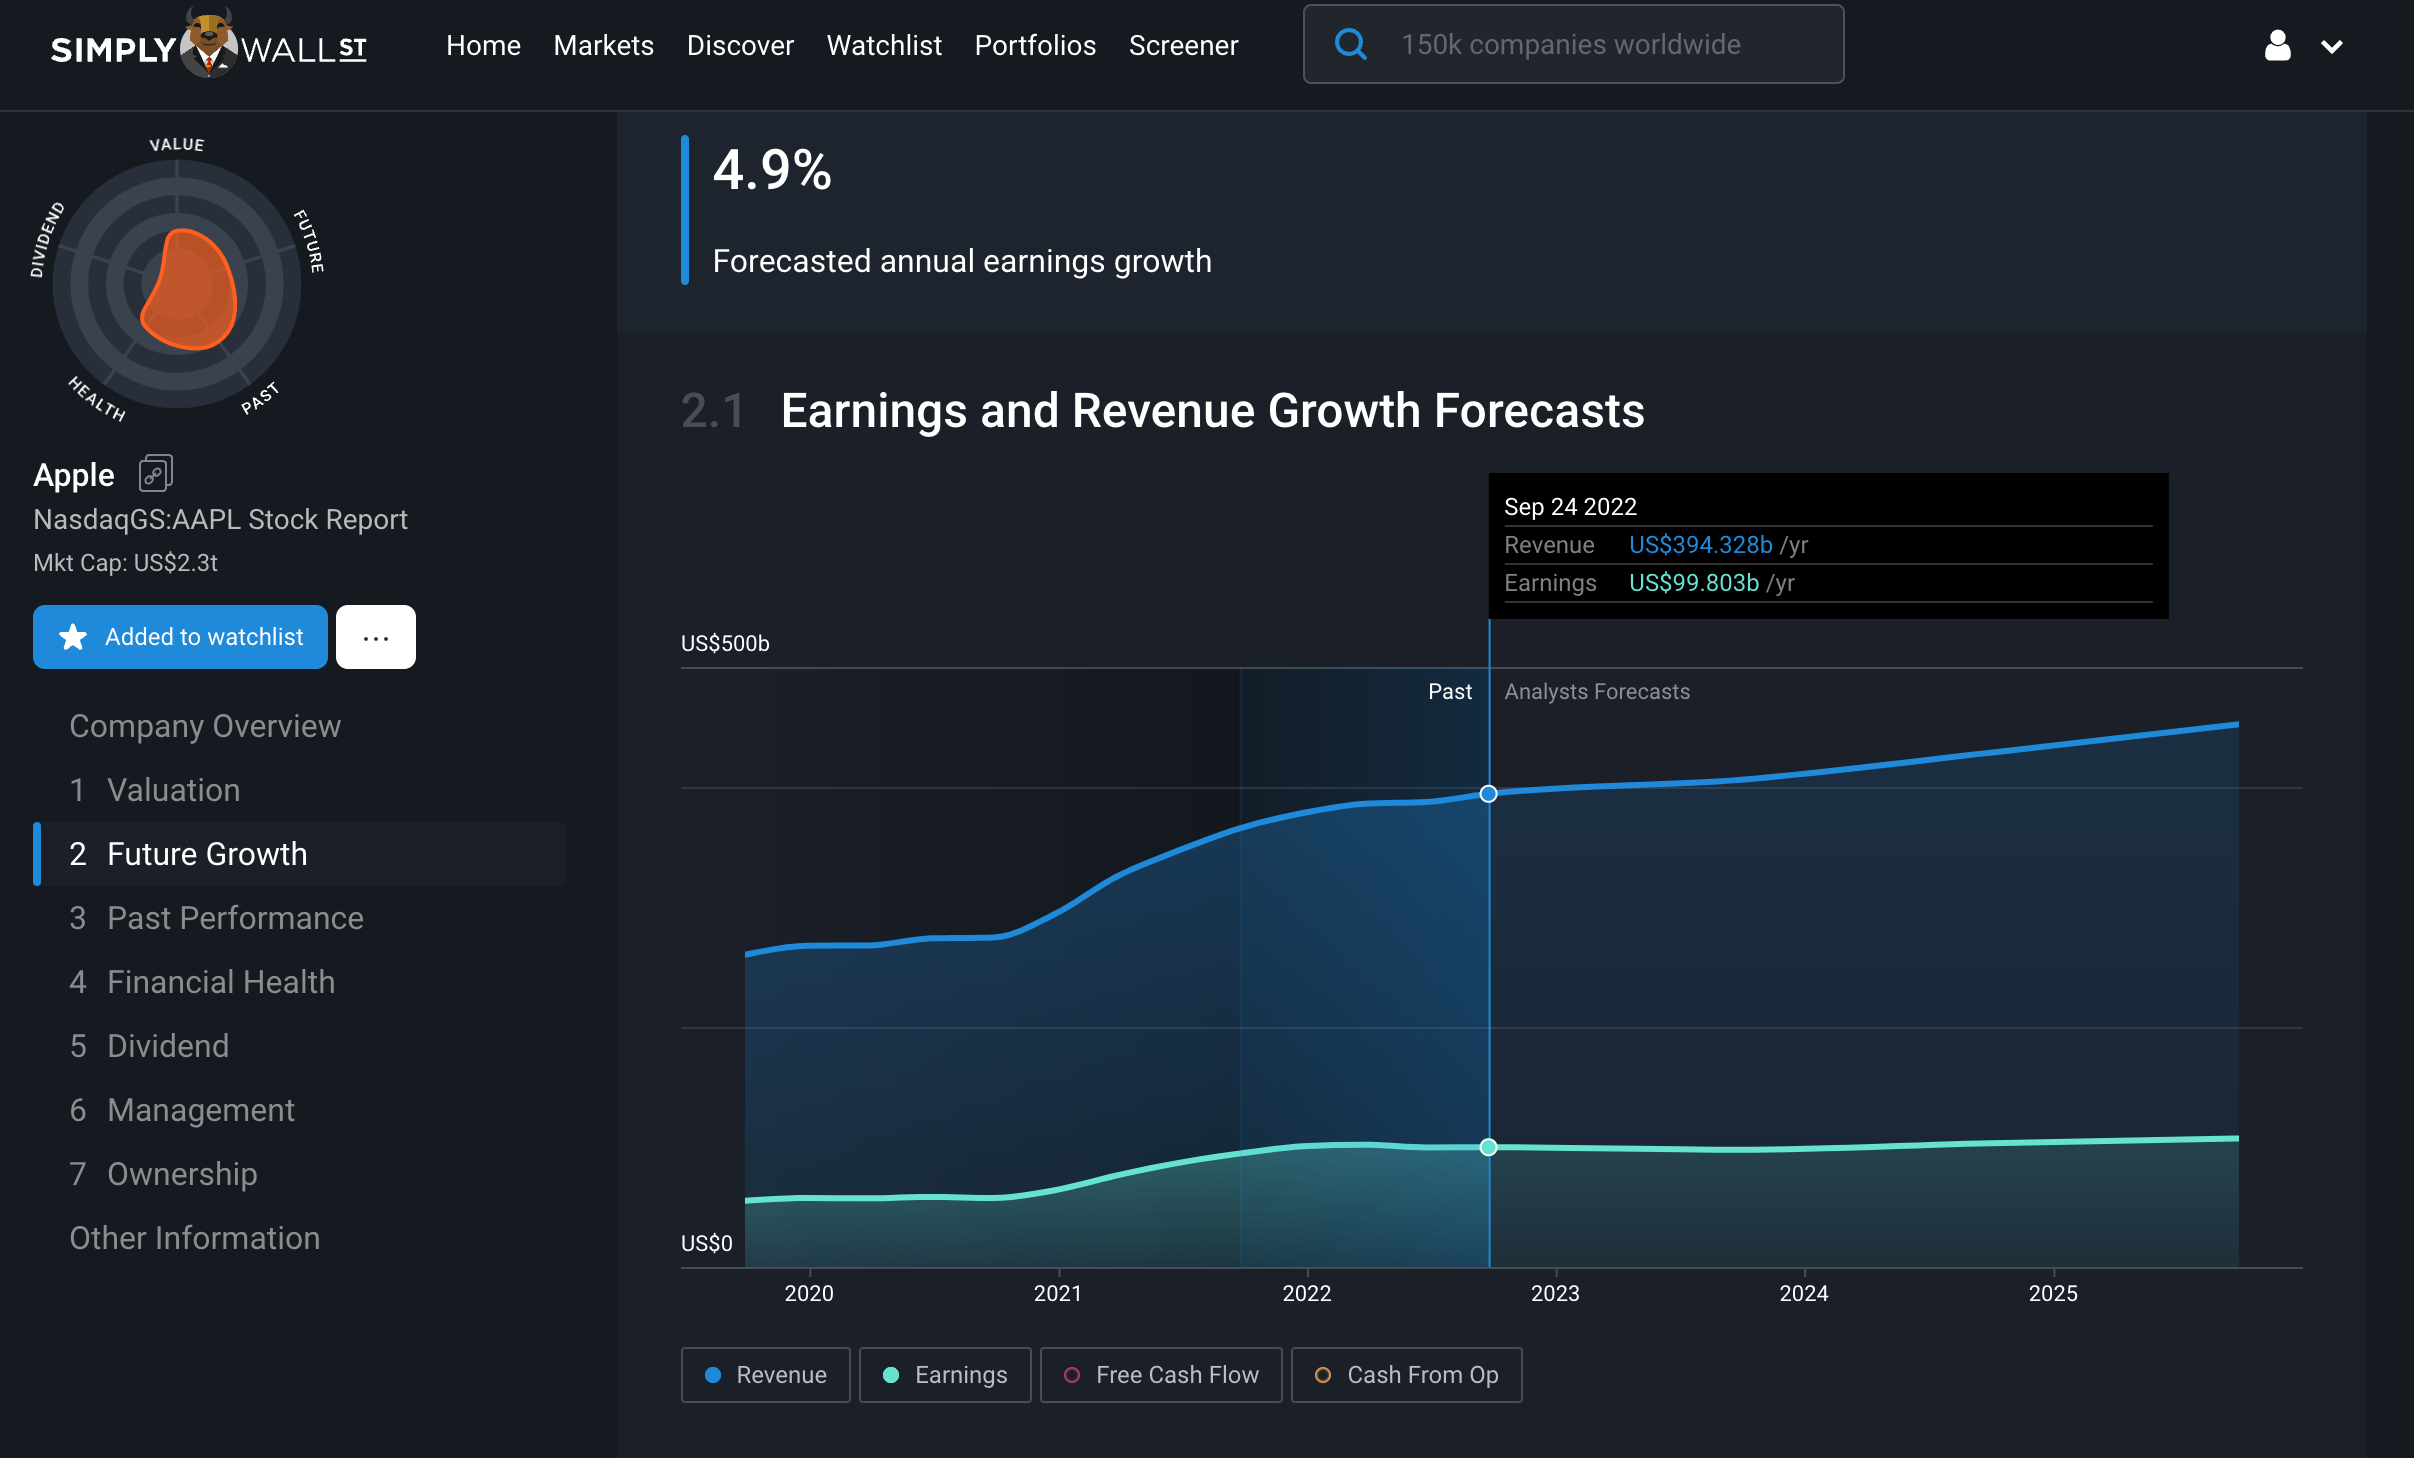
In Apple’s case, it seems like it’s expected to grow its revenue and earnings at about 5% each per year, which is good to see its expected to grow, but it isn’t exactly high growth.
The next chart is the Analyst Future Growth Forecasts , and this shows us how that growth compares to the industry and the market that it’s in.

As we can see, it looks like Apple is expected to grow revenues and earnings faster than the Tech hardware industry, which is good, but it isn’t expected to grow as quickly as the US market. This tells us that there may be faster growing opportunities in the US market, but also more importantly, that all else being equal, we should technically pay a lower price (PE ratio) for Apple, than the US market.
The reason being, Apple is expected to have less growth than the US market, so we shouldn’t pay the same price for lower growth. We’ll be able to check this when we get to Valuation in the next part of this series.
The next chart is Earnings Per Share (EPS) Growth Forecasts , and this shows us if analysts agree with each other on its future earnings potential, and if they’re expected to grow or decline.

This chart and specifically the teal shaded area tells us that some analysts expect low to moderate growth in EPS over the next few years, based on their range of estimates from a low of $6.44 to a high of $8.51 by September 2025.
So this reinforces that it’s a mature business, and it's expected to keep growing, but slowly. Analysts seem to have been pretty accurate in the past, based on the dark blue shaded area, where they’ve mostly been in line with Apple's actual EPS performance.
The next chart is the Future Return on Equity , and this shows us how profitably Apple is expected to allocate shareholders money in 3 years time.
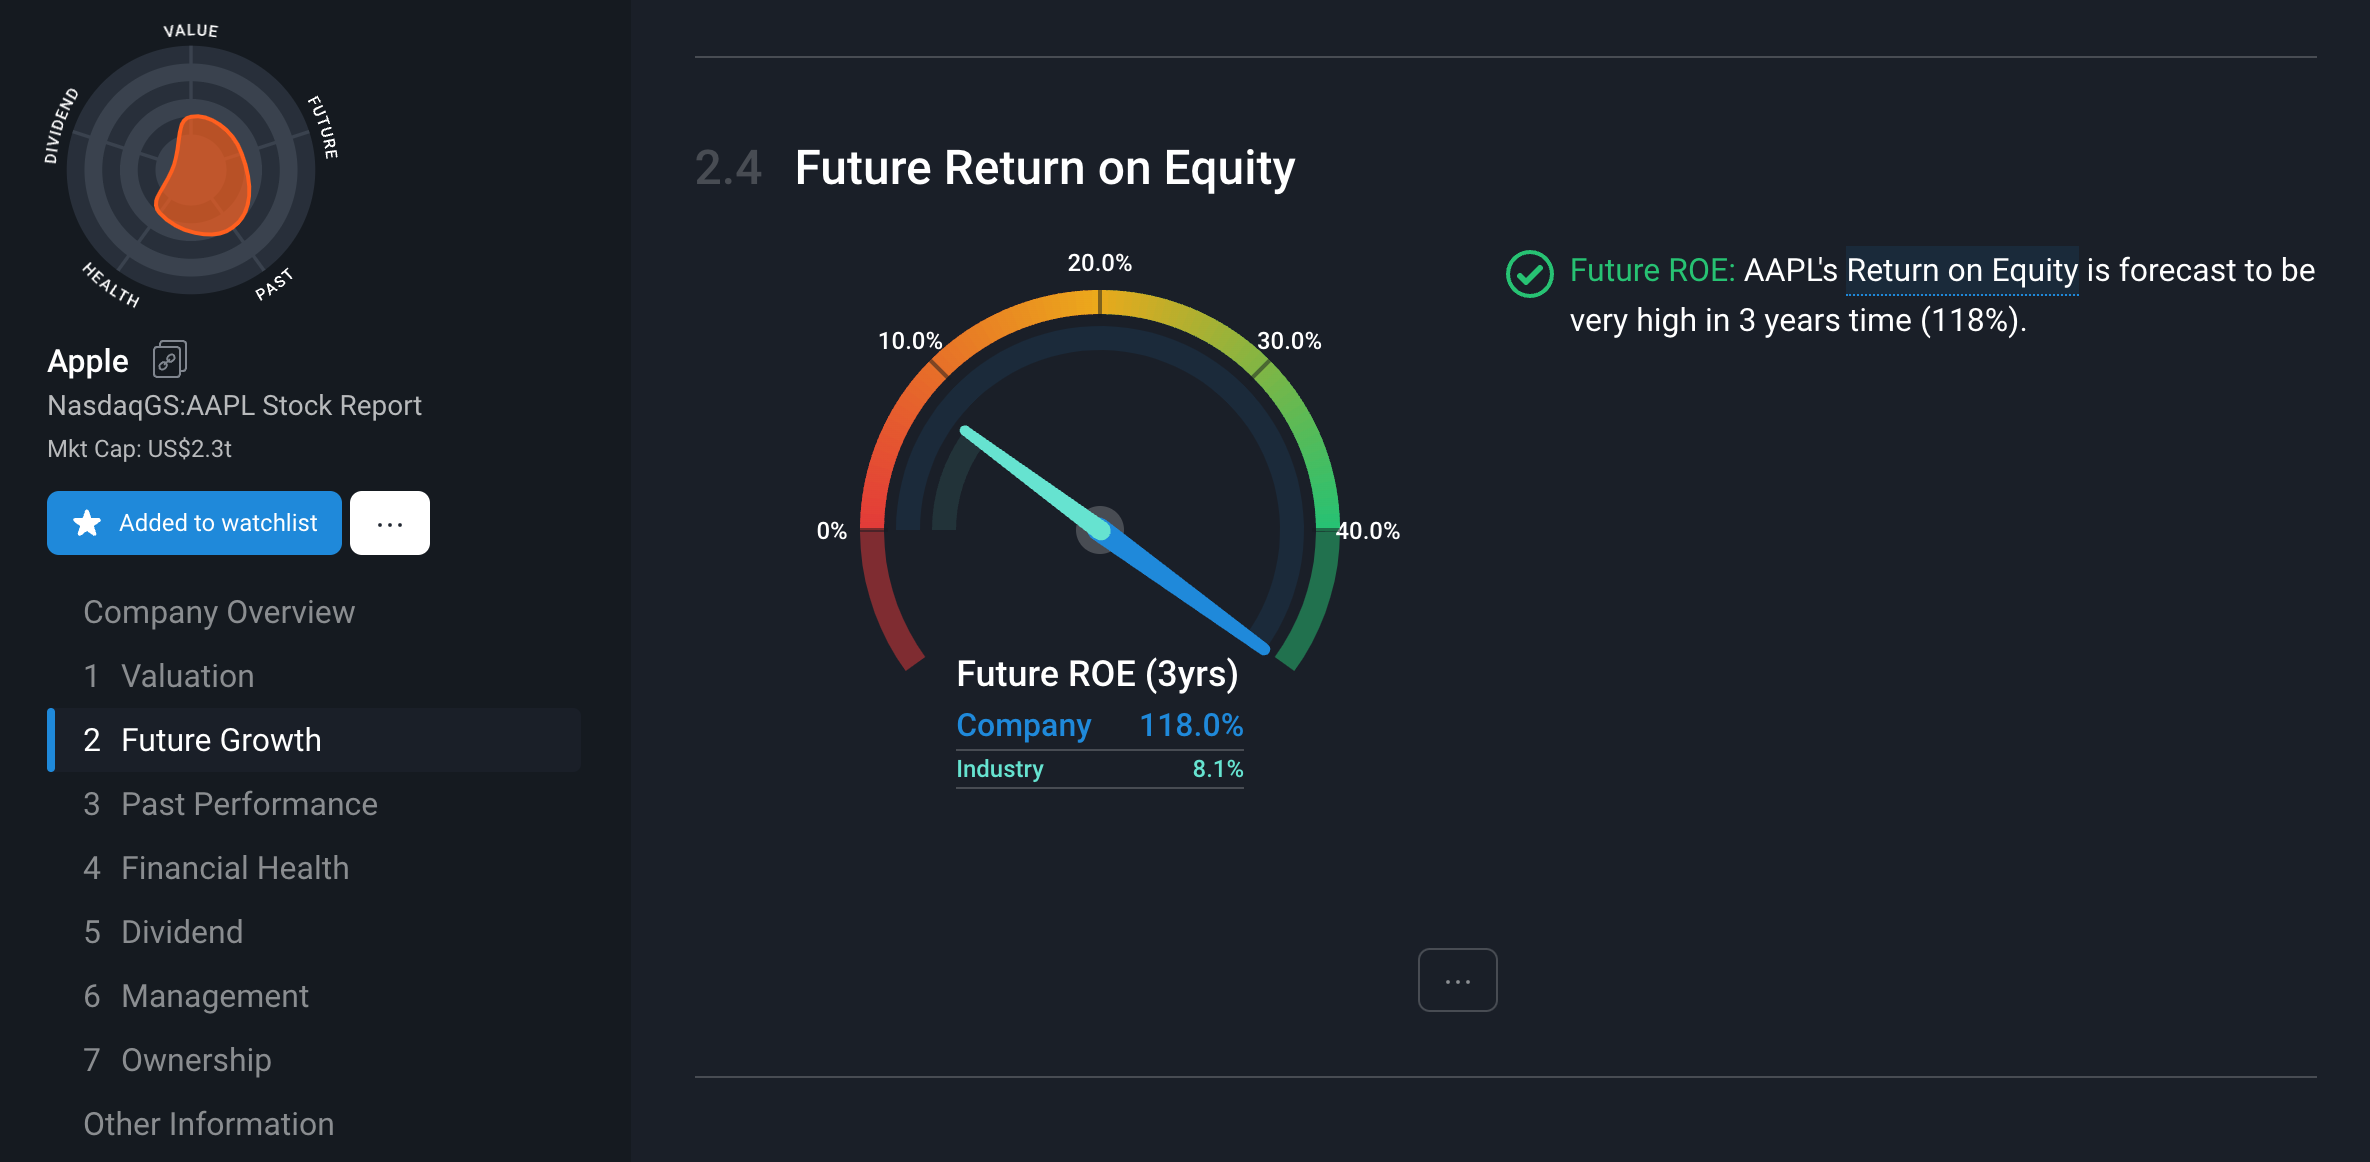
This 118% Return on Equity tells us that Apple is expected to be very profitable in the future! For every dollar of shareholders equity that it invests, it’s expected to generate $1.18 in profits. That’s outstanding. But it’s worth noting that it’s so high because they have a high level of debt, which can skew that number higher. We’ll learn more about this in the Past Performance.
Future Growth Summary: So Apple is expected to keep growing profitably, but not at a huge pace, especially when compared to other opportunities within the US market.
From the Past Performance section, we simply want to see:
It seems like Apple has definitely proven its ability to be profitable and grow over these last 5 years, but the growth seems to be slowing more recently, as we can see in the chart below.
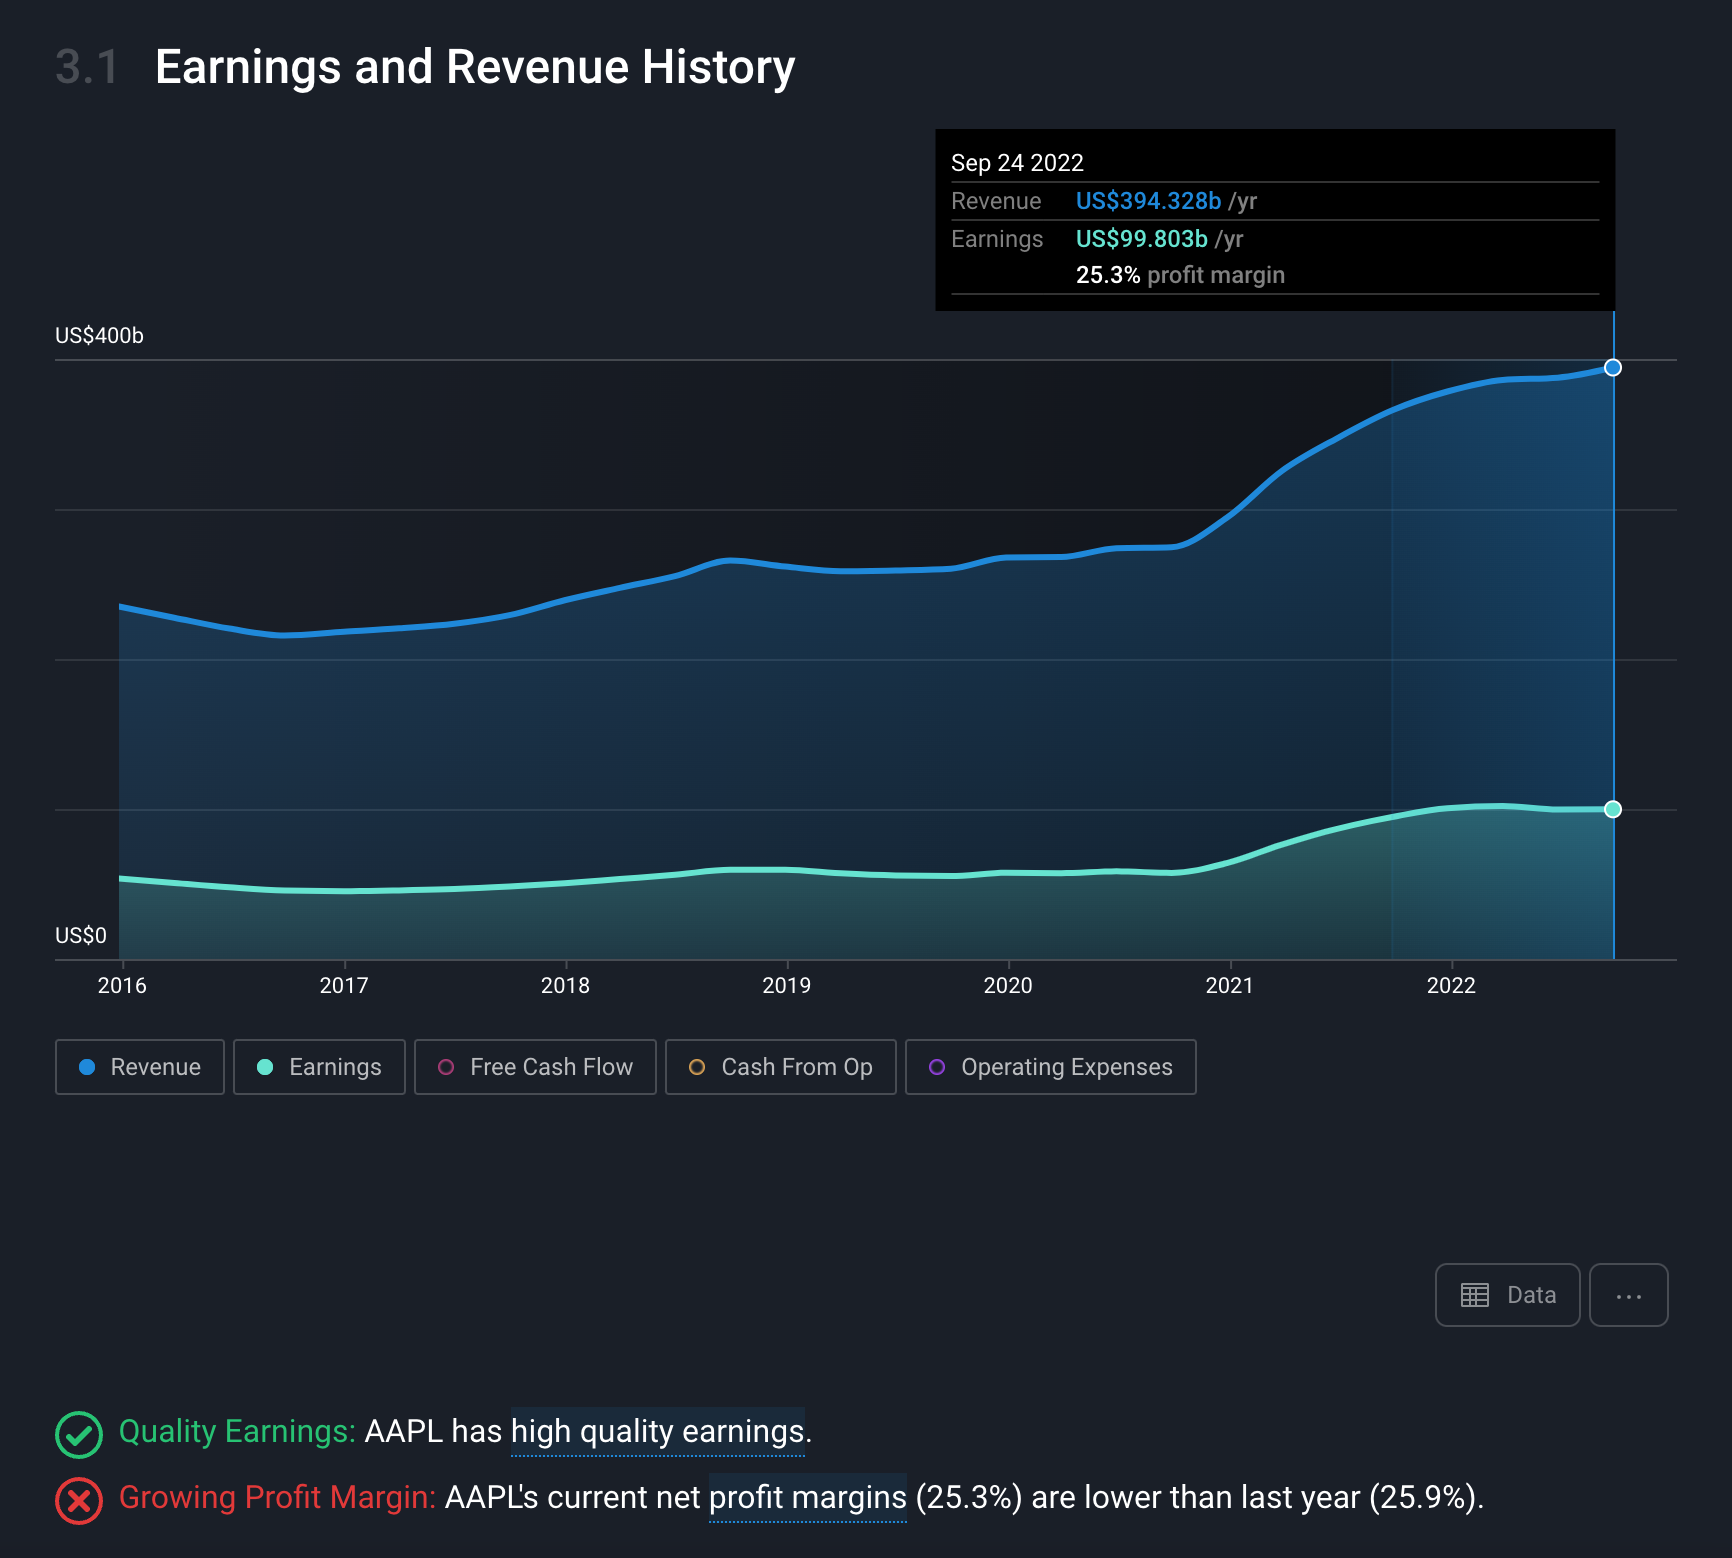
What is more promising though, is that while the industry had a really bad year last year (37% decline in earnings), Apple managed to inch out 5.5% growth in earnings. This helps reinforce that Apple is a market leader, and doesn’t succumb to industry trends as much as others in the field.

Lastly, in terms of its current profitability, Apple is incredibly profitable when we look at its Return on Equity, but we can see where this metric is significantly skewed by Apple’s high level of debt. For every $1 of shareholders equity invested, they currently generate $1.97 in profits. Which is huge.
Important note: Equity is Assets - Liabilities , so when a company takes on more debt, it makes its equity smaller, which in turn makes the Return (profits) on that equity, a higher percentage.

Past performance summary: So Apple has a proven history of profitability and growth, but growth has been slowing recently. Also it utilizes debt to increase its profitability metrics, which is fine, but we’ll find out if this is an issue in the financial health section.
So let’s now check out the balance sheet and see if there are any risks there.
In regards to Financial Health, we simply want to see:
This is mostly about determining if there’s any risk of bankruptcy, and if we should be concerned.

It looks like Apple has more liabilities (long term and short term) than short term assets. This means, if Apple had to pay all that it owes which is due in the next 12 months (short term liabilities), or repay all that is due more than 12 months from now (long term liabilities), it wouldn’t have enough cash and equivalents to repay those debts.
While this isn’t ideal, we should remember this company’s yearly cash profits of around $100bn per year (Past performance section). With that in mind, it’s less of a concern since it could easily use some of those profits to repay its debts if it needed to.
Next we want to see if the company has been increasing or decreasing its debt, and if its current debt is affordable. In this case, it looks like Apple has been increasing its leverage since 2016, and reducing equity (by giving it back to shareholders in the form of dividends and buybacks).

In regards to the affordability, it looks like Apple can easily cover its debts and interest repayments based on those last two checks, which is great to see.
Financial Health Summary: Apple has a fair bit of leverage, but thankfully it can easily afford it.
Next we want to know if the company pays a dividend, and more importantly, we want to see:
It looks like Apple’s dividend isn’t very notable, since it’s only a 0.6% yield, so a lot of the analysis isn’t too meaningful. But regardless, we can still learn a lot from the charts.
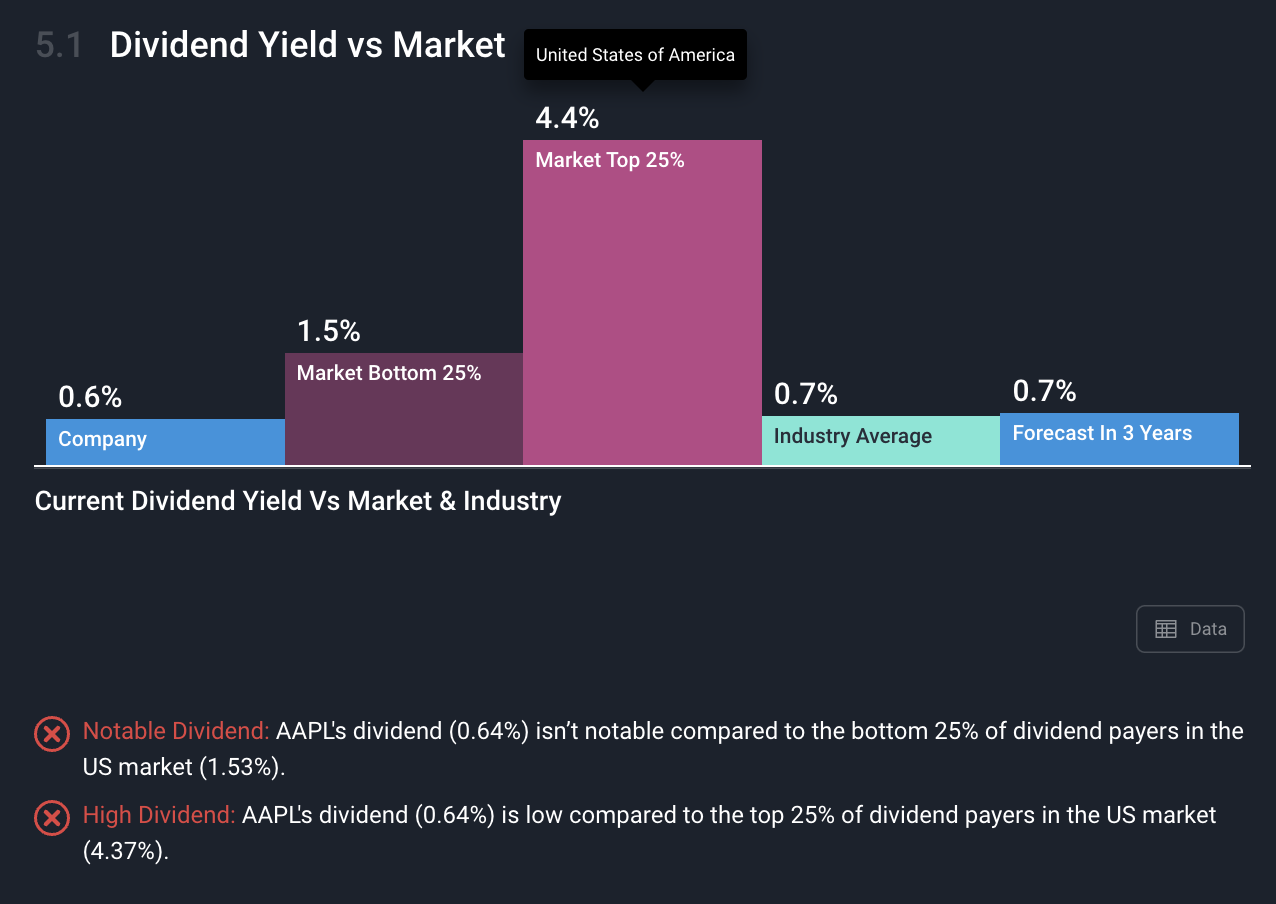
Apple’s current yield isn’t anything to get too excited about if you’re interested in earning income from dividends. However it is in line with the industry average (0.7%), so we shouldn’t be too surprised. It's typical that tech companies retain a lot of their earnings for reinvestment in growth, rather than returning money to shareholders, or they return it via buybacks (which Apple also does).

While the current dividend isn’t notable, this chart tells us a lot. We can see Apple has proven consistency and stability in its dividend payments history. Hypothetically, if you’d bought shares back in 2013 when it was on a 2.8% yield and paying $0.436 per share, you’d now be earning close to 6% yield per year on your initial purchase, because it’s now paying $0.92 per share ($0.92 per share / $15.57 purchase price). That’s why it's important to think long term, in decades rather than months. And try to assess if the current yield could end up being higher many years down the track (like Apple has done from 2013 to now).
Lastly, in regards to the affordability of dividends, we can see that there is very little risk of Apple cutting its dividend, since it has such a low payout ratio. The dividend is well covered by earnings, so even if earnings were to halve for whatever reason, the company would still have plenty of wiggle room to afford to continue paying dividends.

Dividend Summary: Apple’s dividend yield isn’t big, but it has a proven track record of growing its payments over time. It can easily afford current dividends due to the low payout ratio, so there’s low risk of the dividend being cut.
Lastly we just want to see if management is aligned with shareholders. So in these next two sections, management and ownership, we want to see:
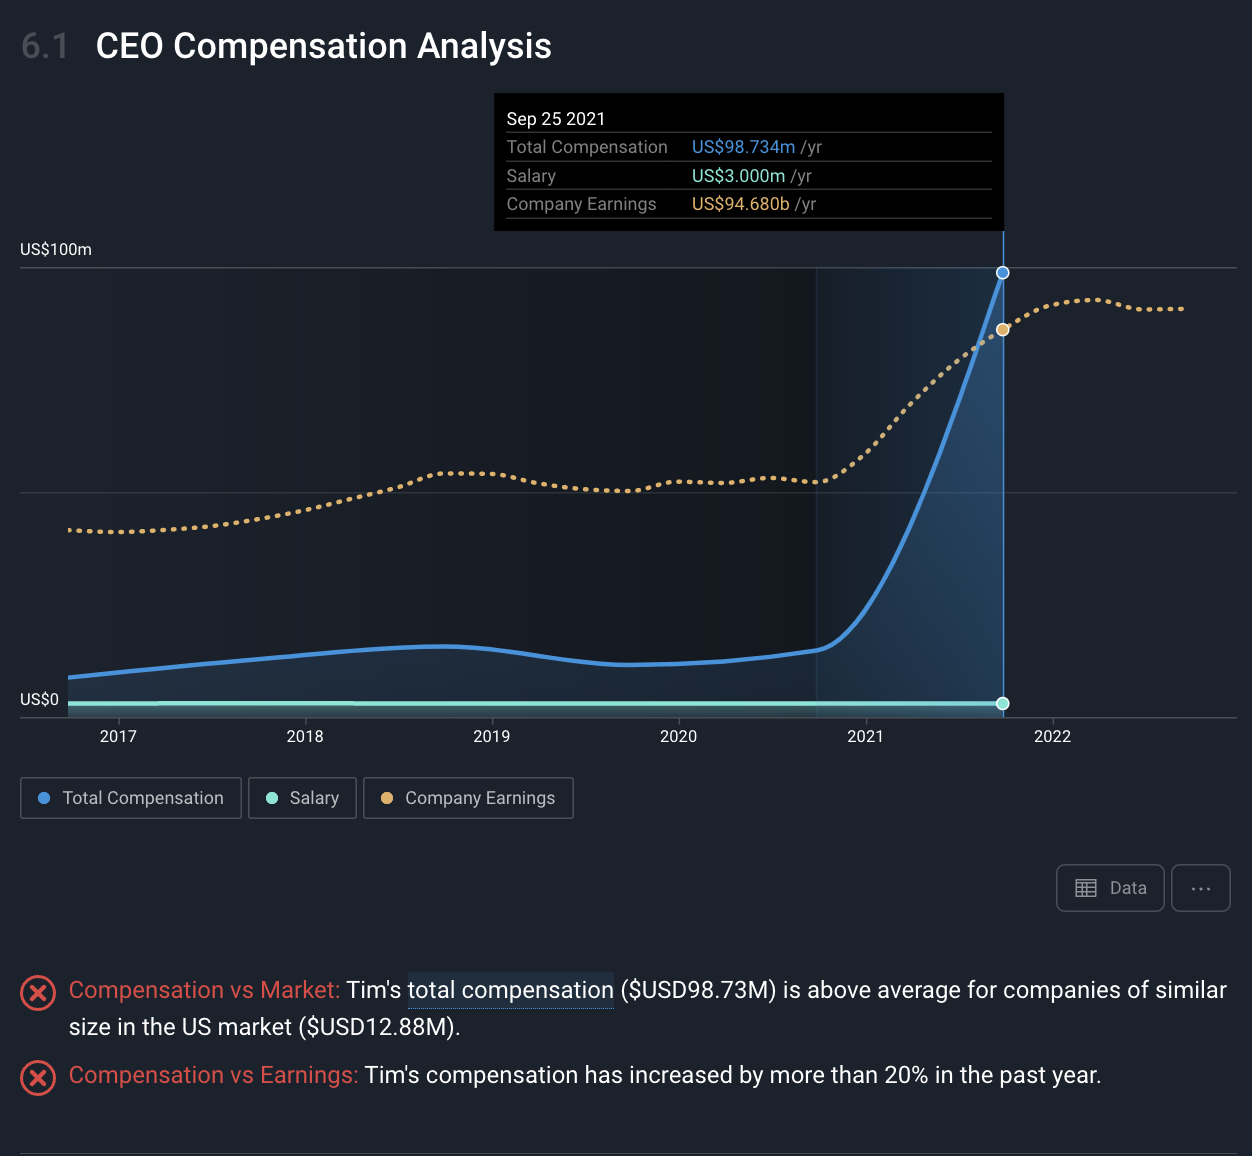
We can see that while the total compensation for the CEO has risen more than 20% in the last year, and it is higher than similar companies, if we look at the chart, it actually seems like his pay is pretty fair.
By the looks of it, the company has almost doubled its earnings (yellow line) under his leadership in just 2 years. So his compensations appears in line with company performance. Prior to that earnings growth, his total compensation was in line with companies of a similar size (about $14m, $3m of which is salary).
From the next table below it, which outlines ownership and compensation for both the board members and management teams, we can see that the vast majority of them have many millions of dollars worth of stock in their own name.
This is a great sign which tells us the leadership teams are invested alongside shareholders (alignment of interests), so they have an incentive to improve the business for shareholders, because they’re shareholders themselves.
Lastly, we can see from the final chart that there are no notable trends of large insider buying or selling, so there’s no huegly meaningful takeaway from this chart.
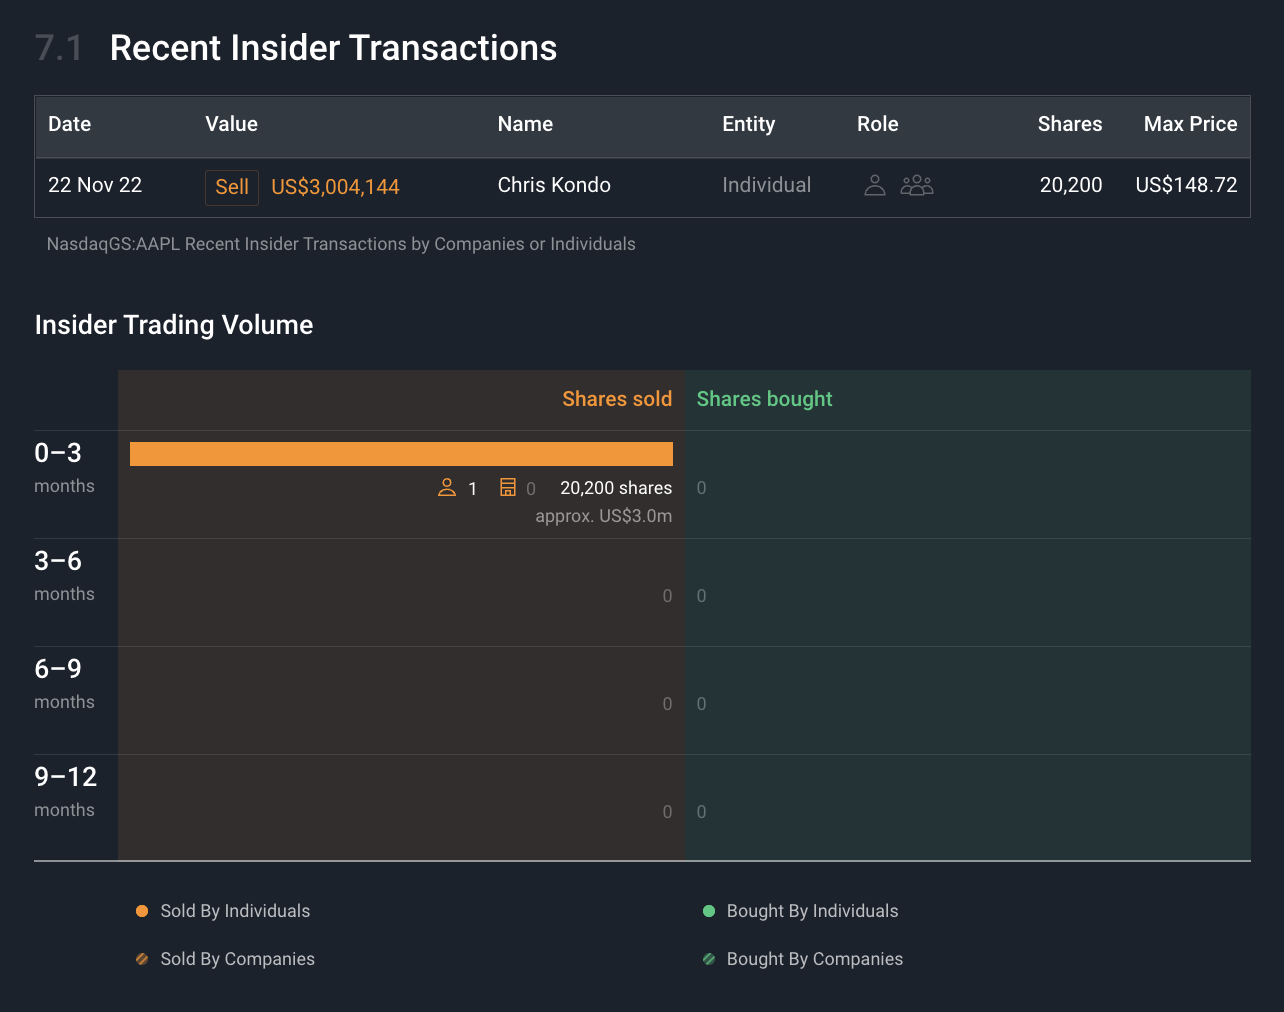
Granted, an insider did sell $3m worth of stock recently, but what we’re looking for is if there’s been any notable trends.
Basically, have there been multiple insiders selling large amounts of stock? That would raise some eyebrows, why have they all been selling? We’d need to investigate, or at least wonder why insiders have been selling in droves.
Alternatively, have multiple insiders been buying large amounts of stock? That would also raise some eyebrows, but in a good way! You typically only buy shares for one reason, because you think they’re going up!
Now that we’ve looked through the whole report, let’s summarize what we’ve learned about the stock in the table below!

We’re in the final stages of building our narrative! Let’s head on to Part 4 to determine if this company is potentially over or undervalued!
Again, here’s the SWS Investment Checklist which we’re using as the foundation for this series.
Lastly, if you've finished the How to Invest like the Best series, we'd love to hear your feedback!
Simply Wall St analyst Michael Paige holds a long position in AAPL. Simply Wall St has no position in any of the companies mentioned. This article is general in nature. Any comments below from SWS employees are their opinions only, should not be taken as financial advice and may not represent the views of Simply Wall St. Unless otherwise advised, SWS employees providing commentary do not own a position in any company mentioned in the article or in their comments. We provide analysis based on historical data and analyst forecasts only using an unbiased methodology and our articles are not intended to be financial advice. It does not constitute a recommendation to buy or sell any stock and does not take account of your objectives, or your financial situation. We aim to bring you long-term focused analysis driven by fundamental data. Note that our analysis may not factor in the latest price-sensitive company announcements or qualitative material.


Level 5, 320 Pitt Street, Sydney


Financial Data provided by S&P Global Market Intelligence LLC, analysis provided by Simply Wall Street Pty Ltd. Copyright © 2023, S&P Global Market Intelligence LLC. All rights reserved.